Houma vs Immigrants from Sudan Householder Income Ages 25 - 44 years
COMPARE
Houma
Immigrants from Sudan
Householder Income Ages 25 - 44 years
Householder Income Ages 25 - 44 years Comparison
Houma
Immigrants from Sudan
$77,044
HOUSEHOLDER INCOME AGES 25 - 44 YEARS
0.0/ 100
METRIC RATING
326th/ 347
METRIC RANK
$86,109
HOUSEHOLDER INCOME AGES 25 - 44 YEARS
0.9/ 100
METRIC RATING
248th/ 347
METRIC RANK
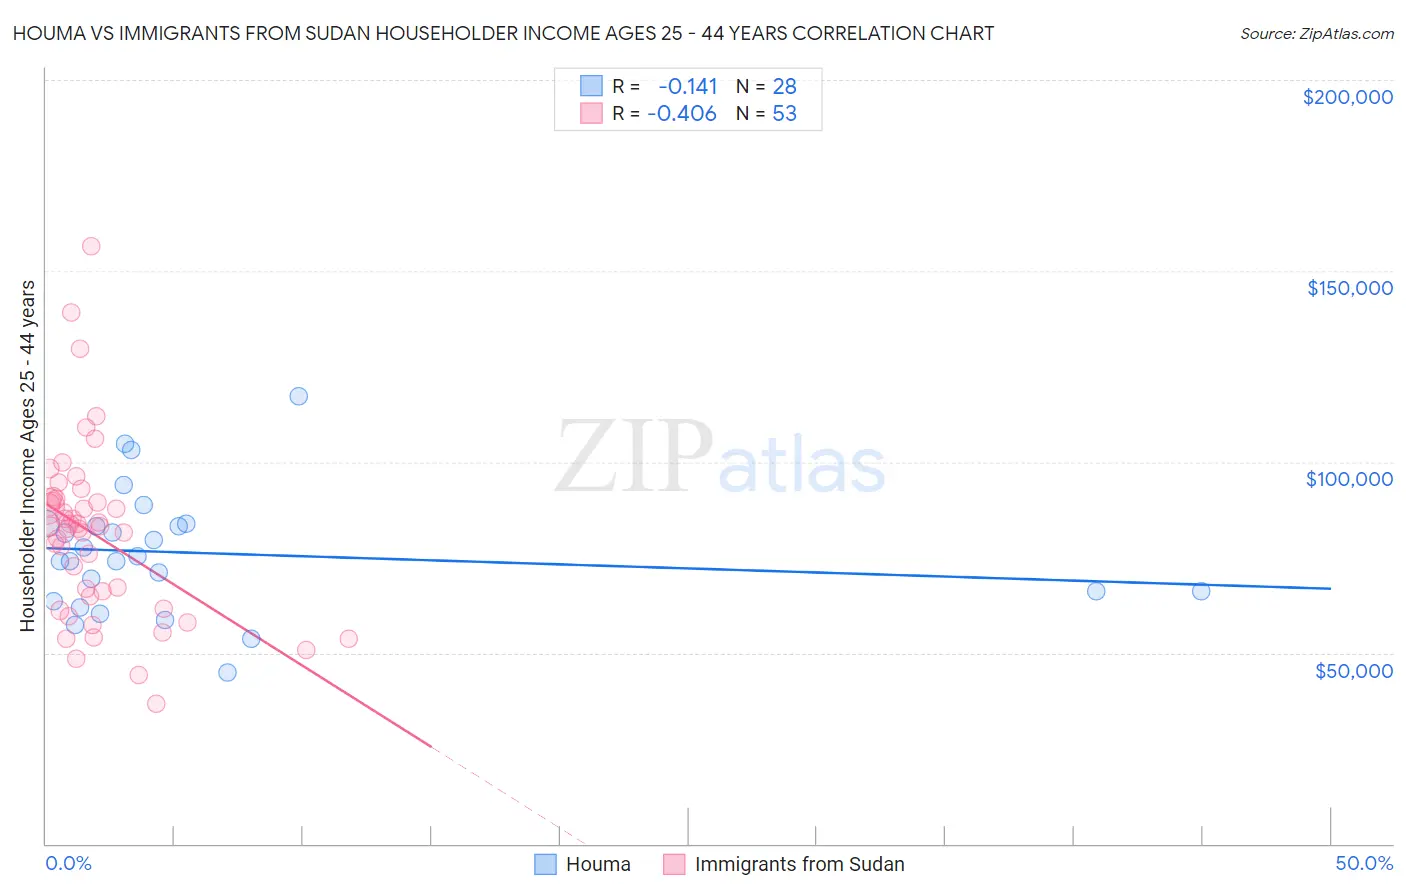
Houma vs Immigrants from Sudan Householder Income Ages 25 - 44 years Correlation Chart
The statistical analysis conducted on geographies consisting of 36,744,797 people shows a poor negative correlation between the proportion of Houma and household income with householder between the ages 25 and 44 in the United States with a correlation coefficient (R) of -0.141 and weighted average of $77,044. Similarly, the statistical analysis conducted on geographies consisting of 118,898,989 people shows a moderate negative correlation between the proportion of Immigrants from Sudan and household income with householder between the ages 25 and 44 in the United States with a correlation coefficient (R) of -0.406 and weighted average of $86,109, a difference of 11.8%.
Householder Income Ages 25 - 44 years Correlation Summary
| Measurement | Houma | Immigrants from Sudan |
| Minimum | $44,839 | $36,667 |
| Maximum | $117,083 | $156,518 |
| Range | $72,244 | $119,851 |
| Mean | $76,117 | $80,997 |
| Median | $74,711 | $83,128 |
| Interquartile 25% (IQ1) | $64,767 | $63,223 |
| Interquartile 75% (IQ3) | $83,511 | $89,871 |
| Interquartile Range (IQR) | $18,745 | $26,648 |
| Standard Deviation (Sample) | $16,133 | $22,850 |
| Standard Deviation (Population) | $15,843 | $22,634 |
Similar Demographics by Householder Income Ages 25 - 44 years
Demographics Similar to Houma by Householder Income Ages 25 - 44 years
In terms of householder income ages 25 - 44 years, the demographic groups most similar to Houma are Sioux ($77,089, a difference of 0.060%), Immigrants from Bahamas ($76,910, a difference of 0.17%), Dutch West Indian ($77,260, a difference of 0.28%), Immigrants from Honduras ($77,328, a difference of 0.37%), and Immigrants from Cuba ($76,701, a difference of 0.45%).
| Demographics | Rating | Rank | Householder Income Ages 25 - 44 years |
| Hondurans | 0.0 /100 | #319 | Tragic $78,540 |
| Choctaw | 0.0 /100 | #320 | Tragic $78,168 |
| Immigrants | Zaire | 0.0 /100 | #321 | Tragic $78,045 |
| Chickasaw | 0.0 /100 | #322 | Tragic $77,929 |
| Immigrants | Honduras | 0.0 /100 | #323 | Tragic $77,328 |
| Dutch West Indians | 0.0 /100 | #324 | Tragic $77,260 |
| Sioux | 0.0 /100 | #325 | Tragic $77,089 |
| Houma | 0.0 /100 | #326 | Tragic $77,044 |
| Immigrants | Bahamas | 0.0 /100 | #327 | Tragic $76,910 |
| Immigrants | Cuba | 0.0 /100 | #328 | Tragic $76,701 |
| Seminole | 0.0 /100 | #329 | Tragic $76,584 |
| Yakama | 0.0 /100 | #330 | Tragic $76,226 |
| Natives/Alaskans | 0.0 /100 | #331 | Tragic $75,647 |
| Bahamians | 0.0 /100 | #332 | Tragic $75,395 |
| Hopi | 0.0 /100 | #333 | Tragic $75,002 |
Demographics Similar to Immigrants from Sudan by Householder Income Ages 25 - 44 years
In terms of householder income ages 25 - 44 years, the demographic groups most similar to Immigrants from Sudan are French American Indian ($85,899, a difference of 0.24%), Pennsylvania German ($85,836, a difference of 0.32%), Cape Verdean ($85,758, a difference of 0.41%), Immigrants from Western Africa ($85,676, a difference of 0.51%), and Immigrants from Nigeria ($86,589, a difference of 0.56%).
| Demographics | Rating | Rank | Householder Income Ages 25 - 44 years |
| Nigerians | 2.2 /100 | #241 | Tragic $87,730 |
| West Indians | 1.7 /100 | #242 | Tragic $87,205 |
| Immigrants | West Indies | 1.5 /100 | #243 | Tragic $87,063 |
| Immigrants | Venezuela | 1.5 /100 | #244 | Tragic $87,038 |
| Immigrants | El Salvador | 1.4 /100 | #245 | Tragic $86,913 |
| Immigrants | Burma/Myanmar | 1.3 /100 | #246 | Tragic $86,736 |
| Immigrants | Nigeria | 1.2 /100 | #247 | Tragic $86,589 |
| Immigrants | Sudan | 0.9 /100 | #248 | Tragic $86,109 |
| French American Indians | 0.8 /100 | #249 | Tragic $85,899 |
| Pennsylvania Germans | 0.8 /100 | #250 | Tragic $85,836 |
| Cape Verdeans | 0.8 /100 | #251 | Tragic $85,758 |
| Immigrants | Western Africa | 0.7 /100 | #252 | Tragic $85,676 |
| British West Indians | 0.7 /100 | #253 | Tragic $85,565 |
| Immigrants | Laos | 0.7 /100 | #254 | Tragic $85,553 |
| German Russians | 0.6 /100 | #255 | Tragic $85,220 |