Lumbee vs Immigrants from Sudan Householder Income Ages 25 - 44 years
COMPARE
Lumbee
Immigrants from Sudan
Householder Income Ages 25 - 44 years
Householder Income Ages 25 - 44 years Comparison
Lumbee
Immigrants from Sudan
$60,305
HOUSEHOLDER INCOME AGES 25 - 44 YEARS
0.0/ 100
METRIC RATING
347th/ 347
METRIC RANK
$86,109
HOUSEHOLDER INCOME AGES 25 - 44 YEARS
0.9/ 100
METRIC RATING
248th/ 347
METRIC RANK
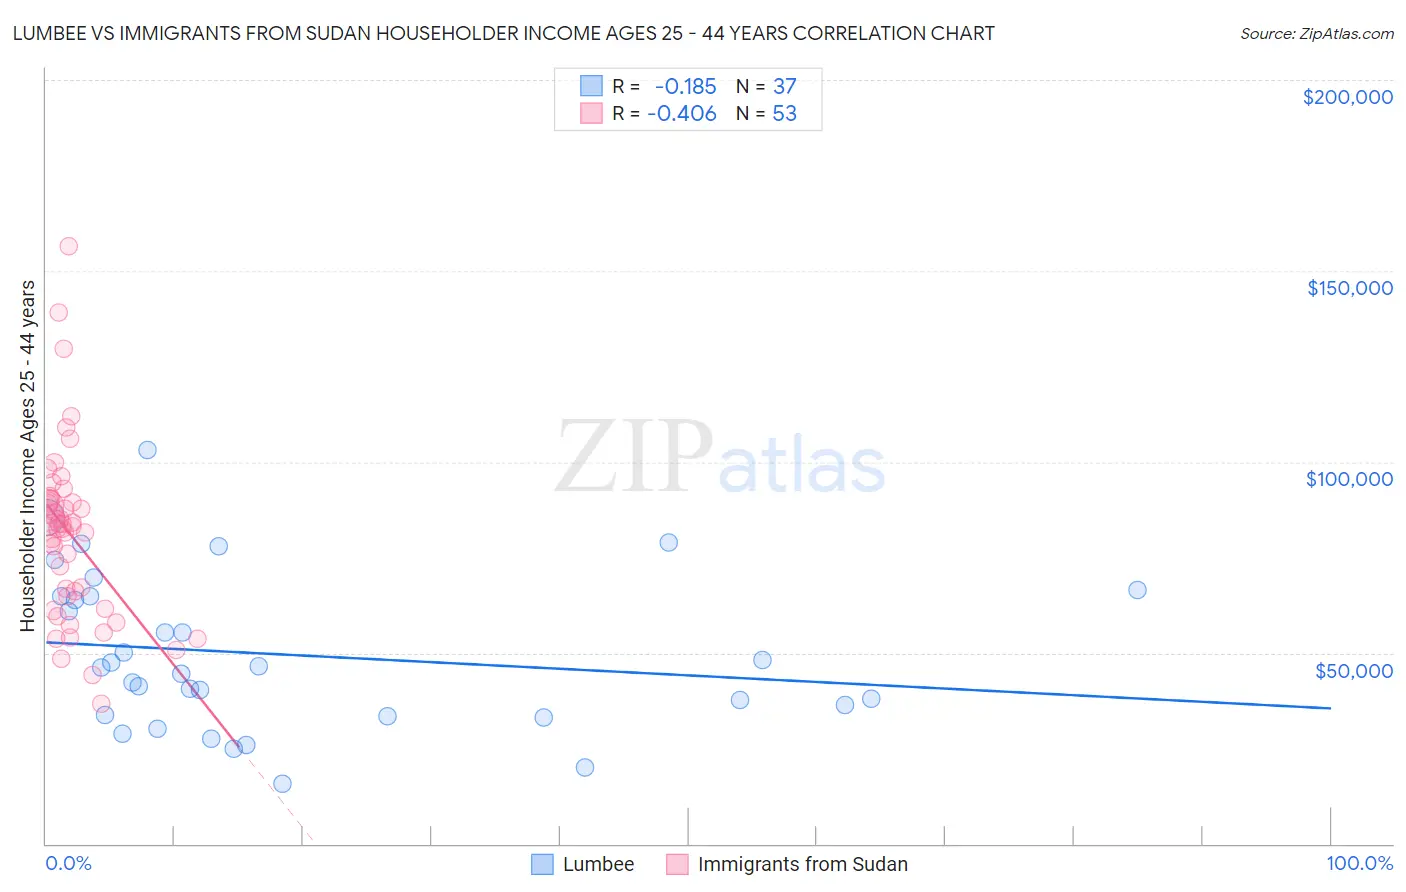
Lumbee vs Immigrants from Sudan Householder Income Ages 25 - 44 years Correlation Chart
The statistical analysis conducted on geographies consisting of 92,171,944 people shows a poor negative correlation between the proportion of Lumbee and household income with householder between the ages 25 and 44 in the United States with a correlation coefficient (R) of -0.185 and weighted average of $60,305. Similarly, the statistical analysis conducted on geographies consisting of 118,898,989 people shows a moderate negative correlation between the proportion of Immigrants from Sudan and household income with householder between the ages 25 and 44 in the United States with a correlation coefficient (R) of -0.406 and weighted average of $86,109, a difference of 42.8%.
Householder Income Ages 25 - 44 years Correlation Summary
| Measurement | Lumbee | Immigrants from Sudan |
| Minimum | $15,613 | $36,667 |
| Maximum | $103,229 | $156,518 |
| Range | $87,616 | $119,851 |
| Mean | $49,513 | $80,997 |
| Median | $46,151 | $83,128 |
| Interquartile 25% (IQ1) | $33,594 | $63,223 |
| Interquartile 75% (IQ3) | $64,818 | $89,871 |
| Interquartile Range (IQR) | $31,224 | $26,648 |
| Standard Deviation (Sample) | $20,339 | $22,850 |
| Standard Deviation (Population) | $20,063 | $22,634 |
Similar Demographics by Householder Income Ages 25 - 44 years
Demographics Similar to Lumbee by Householder Income Ages 25 - 44 years
In terms of householder income ages 25 - 44 years, the demographic groups most similar to Lumbee are Puerto Rican ($65,996, a difference of 9.4%), Navajo ($66,529, a difference of 10.3%), Pueblo ($68,910, a difference of 14.3%), Tohono O'odham ($69,068, a difference of 14.5%), and Crow ($71,337, a difference of 18.3%).
| Demographics | Rating | Rank | Householder Income Ages 25 - 44 years |
| Hopi | 0.0 /100 | #333 | Tragic $75,002 |
| Creek | 0.0 /100 | #334 | Tragic $74,847 |
| Kiowa | 0.0 /100 | #335 | Tragic $74,776 |
| Yup'ik | 0.0 /100 | #336 | Tragic $73,688 |
| Blacks/African Americans | 0.0 /100 | #337 | Tragic $73,370 |
| Immigrants | Yemen | 0.0 /100 | #338 | Tragic $73,043 |
| Yuman | 0.0 /100 | #339 | Tragic $72,956 |
| Immigrants | Congo | 0.0 /100 | #340 | Tragic $72,178 |
| Arapaho | 0.0 /100 | #341 | Tragic $71,697 |
| Crow | 0.0 /100 | #342 | Tragic $71,337 |
| Tohono O'odham | 0.0 /100 | #343 | Tragic $69,068 |
| Pueblo | 0.0 /100 | #344 | Tragic $68,910 |
| Navajo | 0.0 /100 | #345 | Tragic $66,529 |
| Puerto Ricans | 0.0 /100 | #346 | Tragic $65,996 |
| Lumbee | 0.0 /100 | #347 | Tragic $60,305 |
Demographics Similar to Immigrants from Sudan by Householder Income Ages 25 - 44 years
In terms of householder income ages 25 - 44 years, the demographic groups most similar to Immigrants from Sudan are French American Indian ($85,899, a difference of 0.24%), Pennsylvania German ($85,836, a difference of 0.32%), Cape Verdean ($85,758, a difference of 0.41%), Immigrants from Western Africa ($85,676, a difference of 0.51%), and Immigrants from Nigeria ($86,589, a difference of 0.56%).
| Demographics | Rating | Rank | Householder Income Ages 25 - 44 years |
| Nigerians | 2.2 /100 | #241 | Tragic $87,730 |
| West Indians | 1.7 /100 | #242 | Tragic $87,205 |
| Immigrants | West Indies | 1.5 /100 | #243 | Tragic $87,063 |
| Immigrants | Venezuela | 1.5 /100 | #244 | Tragic $87,038 |
| Immigrants | El Salvador | 1.4 /100 | #245 | Tragic $86,913 |
| Immigrants | Burma/Myanmar | 1.3 /100 | #246 | Tragic $86,736 |
| Immigrants | Nigeria | 1.2 /100 | #247 | Tragic $86,589 |
| Immigrants | Sudan | 0.9 /100 | #248 | Tragic $86,109 |
| French American Indians | 0.8 /100 | #249 | Tragic $85,899 |
| Pennsylvania Germans | 0.8 /100 | #250 | Tragic $85,836 |
| Cape Verdeans | 0.8 /100 | #251 | Tragic $85,758 |
| Immigrants | Western Africa | 0.7 /100 | #252 | Tragic $85,676 |
| British West Indians | 0.7 /100 | #253 | Tragic $85,565 |
| Immigrants | Laos | 0.7 /100 | #254 | Tragic $85,553 |
| German Russians | 0.6 /100 | #255 | Tragic $85,220 |