Houma vs French Canadian Householder Income Ages 25 - 44 years
COMPARE
Houma
French Canadian
Householder Income Ages 25 - 44 years
Householder Income Ages 25 - 44 years Comparison
Houma
French Canadians
$77,044
HOUSEHOLDER INCOME AGES 25 - 44 YEARS
0.0/ 100
METRIC RATING
326th/ 347
METRIC RANK
$93,694
HOUSEHOLDER INCOME AGES 25 - 44 YEARS
38.2/ 100
METRIC RATING
179th/ 347
METRIC RANK
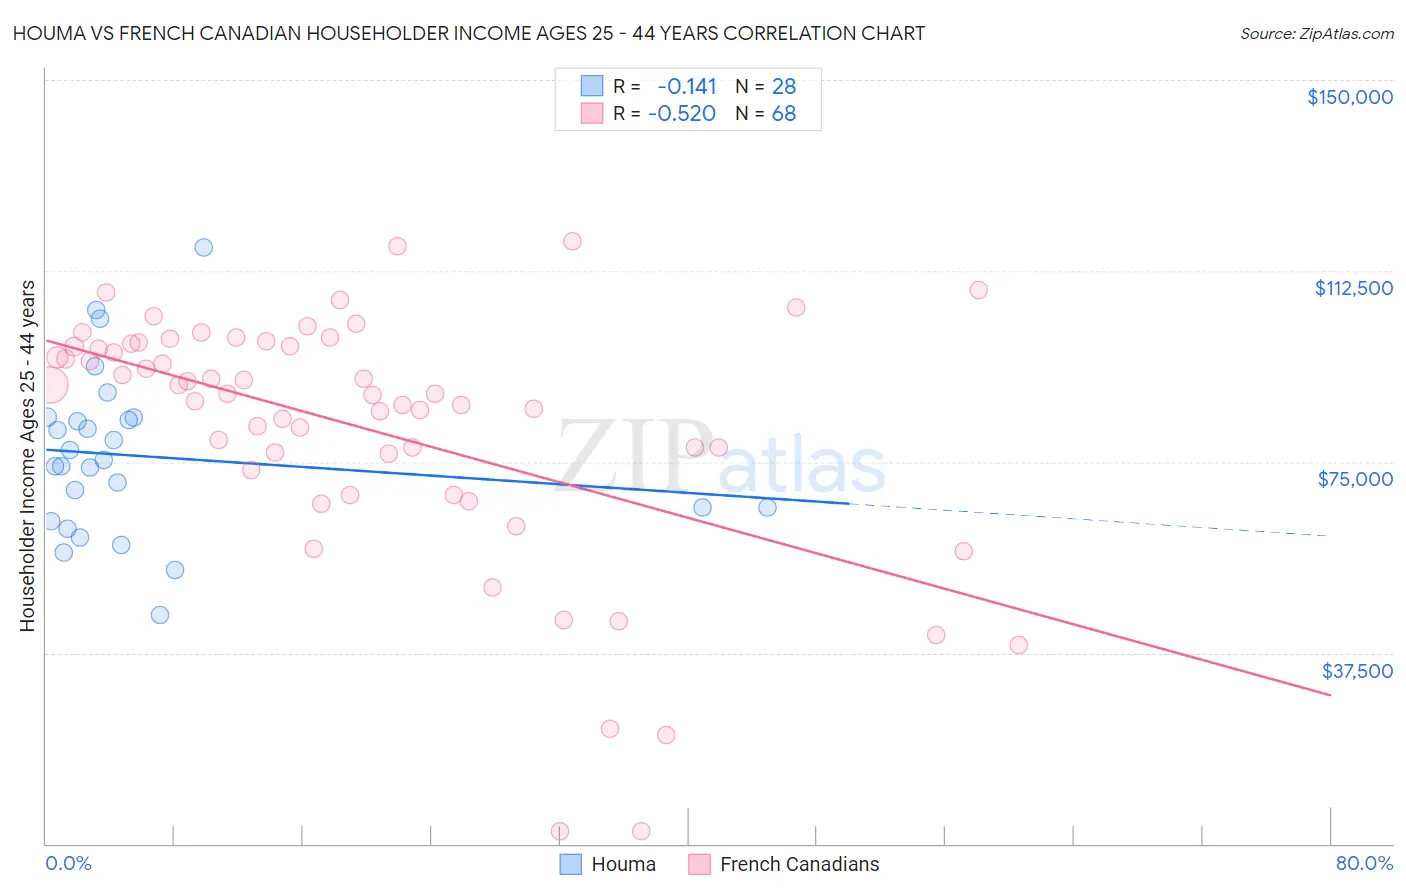
Houma vs French Canadian Householder Income Ages 25 - 44 years Correlation Chart
The statistical analysis conducted on geographies consisting of 36,744,797 people shows a poor negative correlation between the proportion of Houma and household income with householder between the ages 25 and 44 in the United States with a correlation coefficient (R) of -0.141 and weighted average of $77,044. Similarly, the statistical analysis conducted on geographies consisting of 499,836,876 people shows a substantial negative correlation between the proportion of French Canadians and household income with householder between the ages 25 and 44 in the United States with a correlation coefficient (R) of -0.520 and weighted average of $93,694, a difference of 21.6%.
Householder Income Ages 25 - 44 years Correlation Summary
| Measurement | Houma | French Canadian |
| Minimum | $44,839 | $2,499 |
| Maximum | $117,083 | $118,309 |
| Range | $72,244 | $115,810 |
| Mean | $76,117 | $81,603 |
| Median | $74,711 | $88,389 |
| Interquartile 25% (IQ1) | $64,767 | $74,933 |
| Interquartile 75% (IQ3) | $83,511 | $98,053 |
| Interquartile Range (IQR) | $18,745 | $23,120 |
| Standard Deviation (Sample) | $16,133 | $24,791 |
| Standard Deviation (Population) | $15,843 | $24,608 |
Similar Demographics by Householder Income Ages 25 - 44 years
Demographics Similar to Houma by Householder Income Ages 25 - 44 years
In terms of householder income ages 25 - 44 years, the demographic groups most similar to Houma are Sioux ($77,089, a difference of 0.060%), Immigrants from Bahamas ($76,910, a difference of 0.17%), Dutch West Indian ($77,260, a difference of 0.28%), Immigrants from Honduras ($77,328, a difference of 0.37%), and Immigrants from Cuba ($76,701, a difference of 0.45%).
| Demographics | Rating | Rank | Householder Income Ages 25 - 44 years |
| Hondurans | 0.0 /100 | #319 | Tragic $78,540 |
| Choctaw | 0.0 /100 | #320 | Tragic $78,168 |
| Immigrants | Zaire | 0.0 /100 | #321 | Tragic $78,045 |
| Chickasaw | 0.0 /100 | #322 | Tragic $77,929 |
| Immigrants | Honduras | 0.0 /100 | #323 | Tragic $77,328 |
| Dutch West Indians | 0.0 /100 | #324 | Tragic $77,260 |
| Sioux | 0.0 /100 | #325 | Tragic $77,089 |
| Houma | 0.0 /100 | #326 | Tragic $77,044 |
| Immigrants | Bahamas | 0.0 /100 | #327 | Tragic $76,910 |
| Immigrants | Cuba | 0.0 /100 | #328 | Tragic $76,701 |
| Seminole | 0.0 /100 | #329 | Tragic $76,584 |
| Yakama | 0.0 /100 | #330 | Tragic $76,226 |
| Natives/Alaskans | 0.0 /100 | #331 | Tragic $75,647 |
| Bahamians | 0.0 /100 | #332 | Tragic $75,395 |
| Hopi | 0.0 /100 | #333 | Tragic $75,002 |
Demographics Similar to French Canadians by Householder Income Ages 25 - 44 years
In terms of householder income ages 25 - 44 years, the demographic groups most similar to French Canadians are French ($93,665, a difference of 0.030%), Puget Sound Salish ($93,661, a difference of 0.040%), Uruguayan ($93,631, a difference of 0.070%), Guamanian/Chamorro ($93,569, a difference of 0.13%), and German ($93,531, a difference of 0.18%).
| Demographics | Rating | Rank | Householder Income Ages 25 - 44 years |
| Scottish | 50.8 /100 | #172 | Average $94,622 |
| Finns | 50.6 /100 | #173 | Average $94,610 |
| Colombians | 50.0 /100 | #174 | Average $94,565 |
| English | 48.1 /100 | #175 | Average $94,429 |
| Immigrants | Immigrants | 48.0 /100 | #176 | Average $94,423 |
| Belgians | 45.8 /100 | #177 | Average $94,262 |
| Immigrants | South America | 42.8 /100 | #178 | Average $94,042 |
| French Canadians | 38.2 /100 | #179 | Fair $93,694 |
| French | 37.8 /100 | #180 | Fair $93,665 |
| Puget Sound Salish | 37.7 /100 | #181 | Fair $93,661 |
| Uruguayans | 37.3 /100 | #182 | Fair $93,631 |
| Guamanians/Chamorros | 36.5 /100 | #183 | Fair $93,569 |
| Germans | 36.0 /100 | #184 | Fair $93,531 |
| Immigrants | Eritrea | 35.2 /100 | #185 | Fair $93,466 |
| Sierra Leoneans | 34.8 /100 | #186 | Fair $93,435 |