Honduran vs Argentinean Median Male Earnings
COMPARE
Honduran
Argentinean
Median Male Earnings
Median Male Earnings Comparison
Hondurans
Argentineans
$46,374
MEDIAN MALE EARNINGS
0.0/ 100
METRIC RATING
313th/ 347
METRIC RANK
$60,117
MEDIAN MALE EARNINGS
99.6/ 100
METRIC RATING
74th/ 347
METRIC RANK
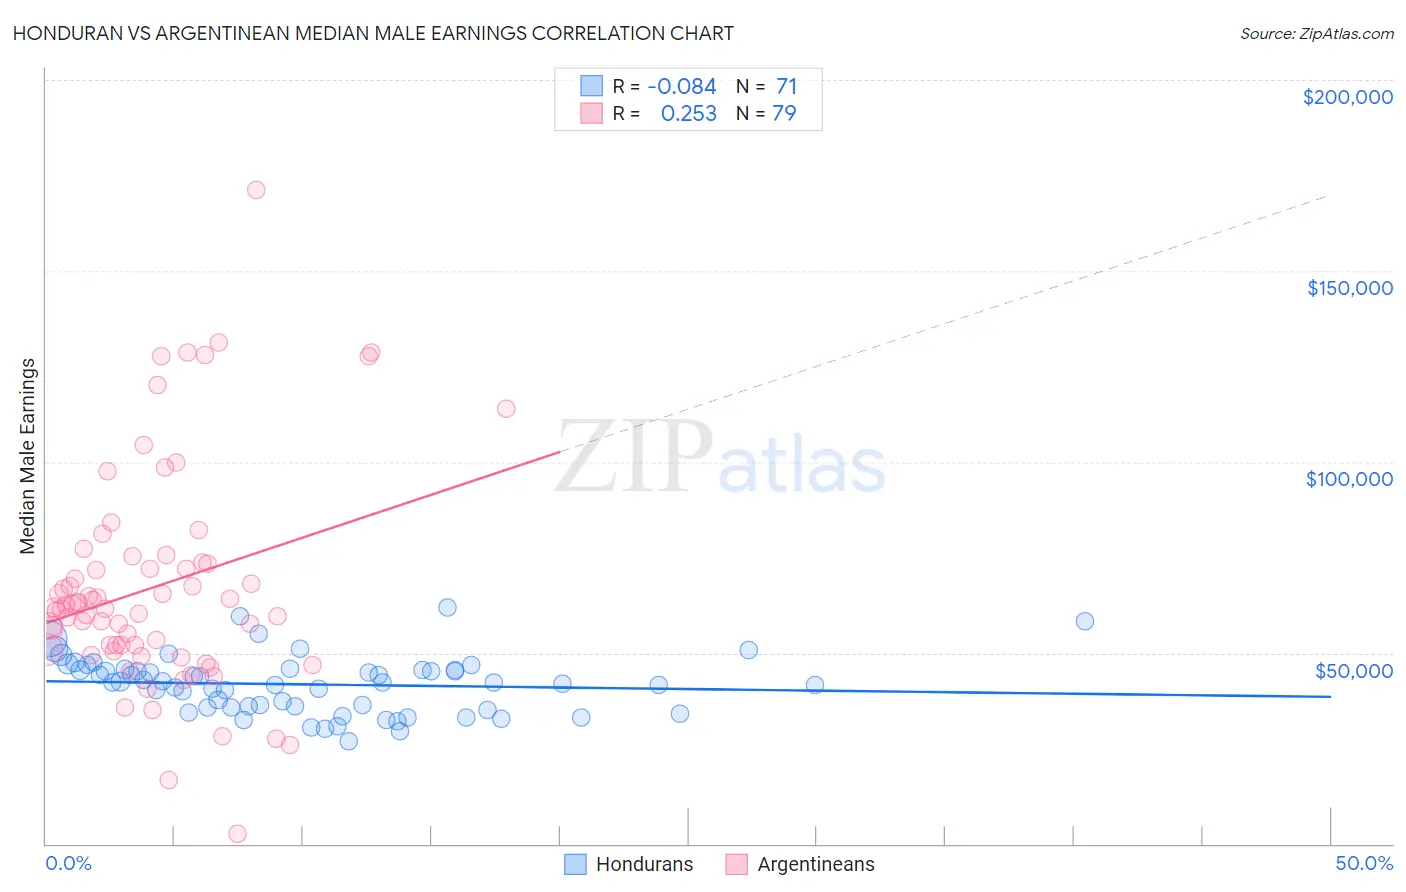
Honduran vs Argentinean Median Male Earnings Correlation Chart
The statistical analysis conducted on geographies consisting of 357,792,552 people shows a slight negative correlation between the proportion of Hondurans and median male earnings in the United States with a correlation coefficient (R) of -0.084 and weighted average of $46,374. Similarly, the statistical analysis conducted on geographies consisting of 297,106,472 people shows a weak positive correlation between the proportion of Argentineans and median male earnings in the United States with a correlation coefficient (R) of 0.253 and weighted average of $60,117, a difference of 29.6%.
Median Male Earnings Correlation Summary
| Measurement | Honduran | Argentinean |
| Minimum | $26,786 | $2,499 |
| Maximum | $61,786 | $171,304 |
| Range | $35,000 | $168,805 |
| Mean | $41,717 | $67,306 |
| Median | $42,264 | $61,977 |
| Interquartile 25% (IQ1) | $35,639 | $50,898 |
| Interquartile 75% (IQ3) | $45,572 | $73,533 |
| Interquartile Range (IQR) | $9,933 | $22,635 |
| Standard Deviation (Sample) | $7,373 | $28,973 |
| Standard Deviation (Population) | $7,321 | $28,789 |
Similar Demographics by Median Male Earnings
Demographics Similar to Hondurans by Median Male Earnings
In terms of median male earnings, the demographic groups most similar to Hondurans are Chippewa ($46,368, a difference of 0.010%), Hispanic or Latino ($46,419, a difference of 0.10%), Apache ($46,429, a difference of 0.12%), Immigrants from Guatemala ($46,244, a difference of 0.28%), and Immigrants from Caribbean ($46,193, a difference of 0.39%).
| Demographics | Rating | Rank | Median Male Earnings |
| Dutch West Indians | 0.0 /100 | #306 | Tragic $46,656 |
| Immigrants | Dominican Republic | 0.0 /100 | #307 | Tragic $46,655 |
| Ottawa | 0.0 /100 | #308 | Tragic $46,611 |
| Creek | 0.0 /100 | #309 | Tragic $46,594 |
| Cubans | 0.0 /100 | #310 | Tragic $46,580 |
| Apache | 0.0 /100 | #311 | Tragic $46,429 |
| Hispanics or Latinos | 0.0 /100 | #312 | Tragic $46,419 |
| Hondurans | 0.0 /100 | #313 | Tragic $46,374 |
| Chippewa | 0.0 /100 | #314 | Tragic $46,368 |
| Immigrants | Guatemala | 0.0 /100 | #315 | Tragic $46,244 |
| Immigrants | Caribbean | 0.0 /100 | #316 | Tragic $46,193 |
| Mexicans | 0.0 /100 | #317 | Tragic $46,147 |
| Cheyenne | 0.0 /100 | #318 | Tragic $46,062 |
| Haitians | 0.0 /100 | #319 | Tragic $45,903 |
| Immigrants | Honduras | 0.0 /100 | #320 | Tragic $45,787 |
Demographics Similar to Argentineans by Median Male Earnings
In terms of median male earnings, the demographic groups most similar to Argentineans are Immigrants from Bolivia ($60,088, a difference of 0.050%), Romanian ($60,063, a difference of 0.090%), Paraguayan ($59,975, a difference of 0.24%), Immigrants from North America ($60,265, a difference of 0.25%), and Immigrants from Egypt ($59,925, a difference of 0.32%).
| Demographics | Rating | Rank | Median Male Earnings |
| Immigrants | Spain | 99.8 /100 | #67 | Exceptional $60,750 |
| Immigrants | Serbia | 99.7 /100 | #68 | Exceptional $60,600 |
| Immigrants | Canada | 99.7 /100 | #69 | Exceptional $60,388 |
| Immigrants | Bulgaria | 99.7 /100 | #70 | Exceptional $60,358 |
| Mongolians | 99.7 /100 | #71 | Exceptional $60,350 |
| Immigrants | Western Europe | 99.7 /100 | #72 | Exceptional $60,334 |
| Immigrants | North America | 99.7 /100 | #73 | Exceptional $60,265 |
| Argentineans | 99.6 /100 | #74 | Exceptional $60,117 |
| Immigrants | Bolivia | 99.6 /100 | #75 | Exceptional $60,088 |
| Romanians | 99.6 /100 | #76 | Exceptional $60,063 |
| Paraguayans | 99.5 /100 | #77 | Exceptional $59,975 |
| Immigrants | Egypt | 99.5 /100 | #78 | Exceptional $59,925 |
| Immigrants | Ukraine | 99.5 /100 | #79 | Exceptional $59,820 |
| Immigrants | Hungary | 99.5 /100 | #80 | Exceptional $59,806 |
| Ukrainians | 99.4 /100 | #81 | Exceptional $59,728 |