Honduran vs Immigrants from Germany Per Capita Income

COMPARE

Honduran
Race
Ancestry
AfghanAfricanAlaska NativeAlaskan AthabascanAlbanianAleutAlsatianAmericanApacheArabArapahoArgentineanArmenianAssyrian/Chaldean/SyriacAustralianAustrianBahamianBangladeshiBarbadianBasqueBelgianBelizeanBermudanBhutaneseBlackfeetBolivianBrazilianBritishBritish West IndianBulgarianBurmeseCajunCambodianCanadianCape VerdeanCarpatho RusynCelticCentral AmericanCentral American IndianCherokeeCheyenneChickasawChileanChineseChippewaChoctawColombianColvilleComancheCosta RicanCreeCreekCroatianCrowCubanCypriotCzechCzechoslovakianDanishDelawareDominicanDutchDutch West IndianEastern EuropeanEcuadorianEgyptianEnglishEstonianEthiopianEuropeanFijianFilipinoFinnishFrenchFrench American IndianFrench CanadianGermanGerman RussianGhanaianGreekGuamanian/ChamorroGuatemalanGuyaneseHaitianHmongHonduranHopiHoumaHungarianIcelanderIndian (Asian)IndonesianInupiatIranianIraqiIrishIroquoisIsraeliItalianJamaicanJapaneseJordanianKenyanKiowaKoreanLaotianLatvianLebaneseLiberianLithuanianLumbeeLuxembourgerMacedonianMalaysianMalteseMarshalleseMenomineeMexicanMexican American IndianMongolianMoroccanNative HawaiianNavajoNepaleseNew ZealanderNicaraguanNigerianNorthern EuropeanNorwegianOkinawanOsageOttawaPaiutePakistaniPalestinianPanamanianParaguayanPennsylvania GermanPeruvianPimaPolishPortuguesePotawatomiPuebloPuerto RicanPuget Sound SalishRomanianRussianSalvadoranSamoanScandinavianScotch-IrishScottishSeminoleSenegaleseSerbianShoshoneSierra LeoneanSiouxSlavicSlovakSloveneSomaliSouth AfricanSouth AmericanSouth American IndianSoviet UnionSpaniardSpanishSpanish AmericanSpanish American IndianSri LankanSubsaharan AfricanSudaneseSwedishSwissSyrianTaiwaneseThaiTlingit-HaidaTohono O'OdhamTonganTrinidadian and TobagonianTsimshianTurkishU.S. Virgin IslanderUgandanUkrainianUruguayanUteVenezuelanVietnameseWelshWest IndianYakamaYaquiYugoslavianYumanYup'ikZimbabwean
Immigration
NonimmigrantsImmigrantsAfghanistanAfricaAlbaniaArgentinaArmeniaAsiaAustraliaAustriaBahamasBangladeshBarbadosBelarusBelgiumBelizeBoliviaBosnia and HerzegovinaBrazilBulgariaBurma/MyanmarCabo VerdeCambodiaCameroonCanadaCaribbeanCentral AmericaChileChinaColombiaCongoCosta RicaCroatiaCubaCzechoslovakiaDenmarkDominicaDominican RepublicEastern AfricaEastern AsiaEastern EuropeEcuadorEgyptEl SalvadorEnglandEritreaEthiopiaEuropeFijiFranceGhanaGreeceGrenadaGuatemalaGuyanaHaitiHondurasHong KongHungaryIndiaIndonesiaIranIraqIrelandIsraelItalyJamaicaJapanJordanKazakhstanKenyaKoreaKuwaitLaosLatin AmericaLatviaLebanonLiberiaLithuaniaMalaysiaMexicoMicronesiaMiddle AfricaMoldovaMoroccoNepalNetherlandsNicaraguaNigeriaNorth AmericaNorth MacedoniaNorthern AfricaNorthern EuropeNorwayOceaniaPakistanPanamaPeruPhilippinesPolandPortugalRomaniaRussiaSaudi ArabiaScotlandSenegalSerbiaSierra LeoneSingaporeSomaliaSouth AfricaSouth AmericaSouth Central AsiaSouth Eastern AsiaSouthern EuropeSpainSri LankaSt. Vincent and the GrenadinesSudanSwedenSwitzerlandSyriaTaiwanThailandTrinidad and TobagoTurkeyUgandaUkraineUruguayUzbekistanVenezuelaVietnamWest IndiesWestern AfricaWestern AsiaWestern EuropeYemenZaireZimbabweAzores
Immigrants from Germany
Race
Ancestry
AfghanAfricanAlaska NativeAlaskan AthabascanAlbanianAleutAlsatianAmericanApacheArabArapahoArgentineanArmenianAssyrian/Chaldean/SyriacAustralianAustrianBahamianBangladeshiBarbadianBasqueBelgianBelizeanBermudanBhutaneseBlackfeetBolivianBrazilianBritishBritish West IndianBulgarianBurmeseCajunCambodianCanadianCape VerdeanCarpatho RusynCelticCentral AmericanCentral American IndianCherokeeCheyenneChickasawChileanChineseChippewaChoctawColombianColvilleComancheCosta RicanCreeCreekCroatianCrowCubanCypriotCzechCzechoslovakianDanishDelawareDominicanDutchDutch West IndianEastern EuropeanEcuadorianEgyptianEnglishEstonianEthiopianEuropeanFijianFilipinoFinnishFrenchFrench American IndianFrench CanadianGermanGerman RussianGhanaianGreekGuamanian/ChamorroGuatemalanGuyaneseHaitianHmongHopiHoumaHungarianIcelanderIndian (Asian)IndonesianInupiatIranianIraqiIrishIroquoisIsraeliItalianJamaicanJapaneseJordanianKenyanKiowaKoreanLaotianLatvianLebaneseLiberianLithuanianLumbeeLuxembourgerMacedonianMalaysianMalteseMarshalleseMenomineeMexicanMexican American IndianMongolianMoroccanNative HawaiianNavajoNepaleseNew ZealanderNicaraguanNigerianNorthern EuropeanNorwegianOkinawanOsageOttawaPaiutePakistaniPalestinianPanamanianParaguayanPennsylvania GermanPeruvianPimaPolishPortuguesePotawatomiPuebloPuerto RicanPuget Sound SalishRomanianRussianSalvadoranSamoanScandinavianScotch-IrishScottishSeminoleSenegaleseSerbianShoshoneSierra LeoneanSiouxSlavicSlovakSloveneSomaliSouth AfricanSouth AmericanSouth American IndianSoviet UnionSpaniardSpanishSpanish AmericanSpanish American IndianSri LankanSubsaharan AfricanSudaneseSwedishSwissSyrianTaiwaneseThaiTlingit-HaidaTohono O'OdhamTonganTrinidadian and TobagonianTsimshianTurkishU.S. Virgin IslanderUgandanUkrainianUruguayanUteVenezuelanVietnameseWelshWest IndianYakamaYaquiYugoslavianYumanYup'ikZimbabwean
Immigration
NonimmigrantsImmigrantsAfghanistanAfricaAlbaniaArgentinaArmeniaAsiaAustraliaAustriaBahamasBangladeshBarbadosBelarusBelgiumBelizeBoliviaBosnia and HerzegovinaBrazilBulgariaBurma/MyanmarCabo VerdeCambodiaCameroonCanadaCaribbeanCentral AmericaChileChinaColombiaCongoCosta RicaCroatiaCubaCzechoslovakiaDenmarkDominicaDominican RepublicEastern AfricaEastern AsiaEastern EuropeEcuadorEgyptEl SalvadorEnglandEritreaEthiopiaEuropeFijiFranceGermanyGhanaGreeceGrenadaGuatemalaGuyanaHaitiHondurasHong KongHungaryIndiaIndonesiaIranIraqIrelandIsraelItalyJamaicaJapanJordanKazakhstanKenyaKoreaKuwaitLaosLatin AmericaLatviaLebanonLiberiaLithuaniaMalaysiaMexicoMicronesiaMiddle AfricaMoldovaMoroccoNepalNetherlandsNicaraguaNigeriaNorth AmericaNorth MacedoniaNorthern AfricaNorthern EuropeNorwayOceaniaPakistanPanamaPeruPhilippinesPolandPortugalRomaniaRussiaSaudi ArabiaScotlandSenegalSerbiaSierra LeoneSingaporeSomaliaSouth AfricaSouth AmericaSouth Central AsiaSouth Eastern AsiaSouthern EuropeSpainSri LankaSt. Vincent and the GrenadinesSudanSwedenSwitzerlandSyriaTaiwanThailandTrinidad and TobagoTurkeyUgandaUkraineUruguayUzbekistanVenezuelaVietnamWest IndiesWestern AfricaWestern AsiaWestern EuropeYemenZaireZimbabweAzores
Per Capita Income
Income
Poverty
Unemployment
Labor Participation
Family Structure
Vehicle Availability
Education Level
Disability

Per Capita Income Comparison

Hondurans

Immigrants from Germany

Tragic
Exceptional
$37,031
PER CAPITA INCOME
0.1/ 100
METRIC RATING
304th/ 347
METRIC RANK
$45,751
PER CAPITA INCOME
91.3/ 100
METRIC RATING
127th/ 347
METRIC RANK

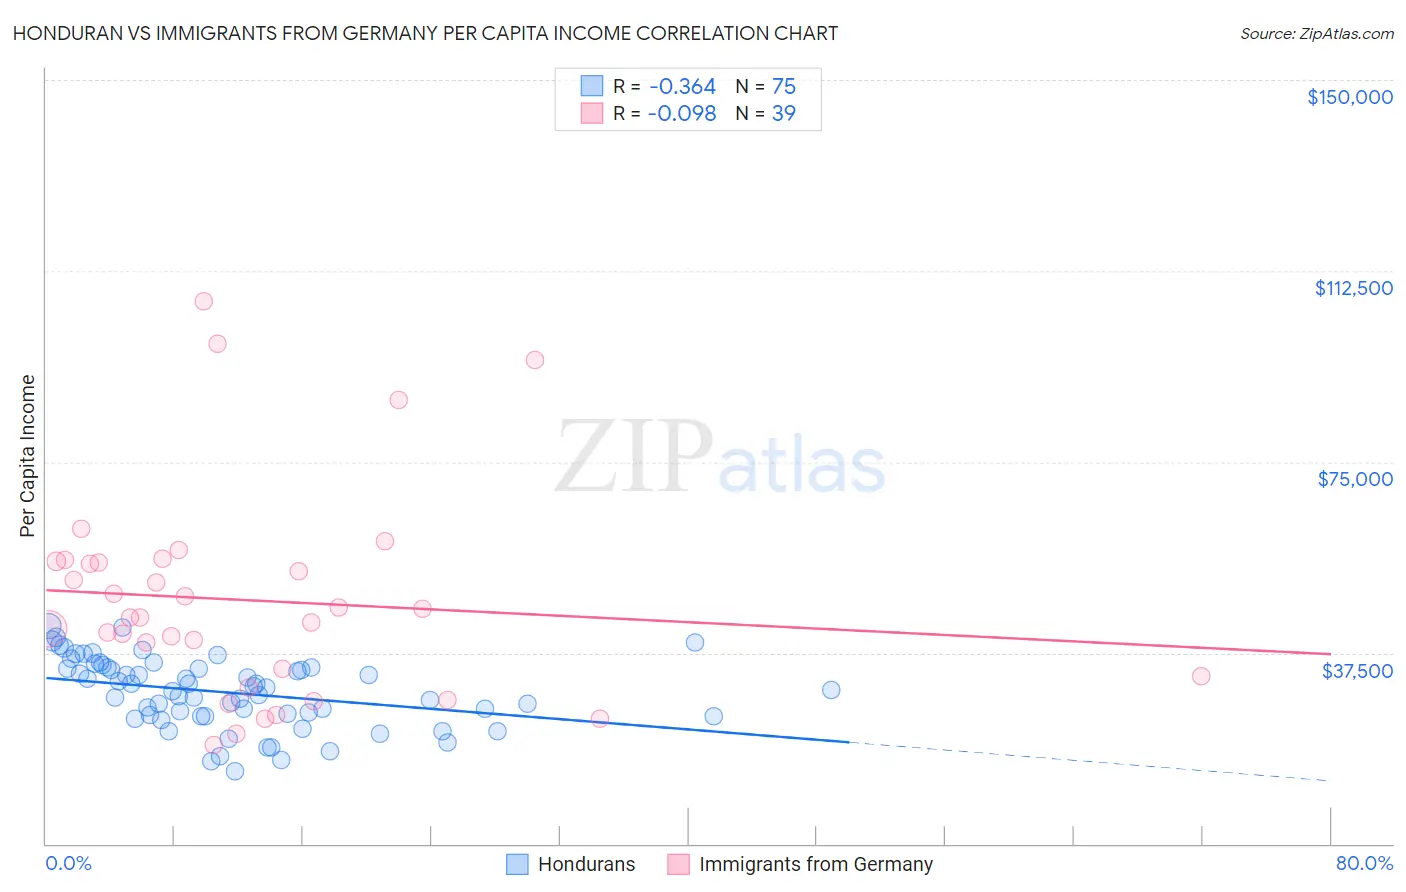
Honduran vs Immigrants from Germany Per Capita Income Correlation Chart

The statistical analysis conducted on geographies consisting of 357,835,074 people shows a mild negative correlation between the proportion of Hondurans and per capita income in the United States with a correlation coefficient (R) of -0.364 and weighted average of $37,031. Similarly, the statistical analysis conducted on geographies consisting of 463,898,714 people shows a slight negative correlation between the proportion of Immigrants from Germany and per capita income in the United States with a correlation coefficient (R) of -0.098 and weighted average of $45,751, a difference of 23.5%.
Honduran vs Immigrants from Germany Per Capita Income

Per Capita Income Correlation Summary

MeasurementHonduranImmigrants from Germany
Minimum$14,358$19,389
Maximum$42,674$106,492
Range$28,316$87,103
Mean$29,671$47,817
Median$30,191$44,537
Interquartile 25% (IQ1)$25,099$32,967
Interquartile 75% (IQ3)$34,632$55,483
Interquartile Range (IQR)$9,533$22,516
Standard Deviation (Sample)$6,736$20,412
Standard Deviation (Population)$6,690$20,149

Similar Demographics by Per Capita Income

Demographics Similar to Hondurans by Per Capita Income

In terms of per capita income, the demographic groups most similar to Hondurans are Inupiat ($36,999, a difference of 0.080%), Paiute ($37,066, a difference of 0.090%), Shoshone ($37,072, a difference of 0.11%), Ottawa ($37,101, a difference of 0.19%), and Immigrants from Bahamas ($37,193, a difference of 0.44%).
DemographicsRating | RankPer Capita Income
Haitians
0.1
/100
|
#297
Tragic
$37,289
Immigrants | Caribbean
0.1
/100
|
#298
Tragic
$37,254
Cherokee
0.1
/100
|
#299
Tragic
$37,203
Immigrants | Bahamas
0.1
/100
|
#300
Tragic
$37,193
Ottawa
0.1
/100
|
#301
Tragic
$37,101
Shoshone
0.1
/100
|
#302
Tragic
$37,072
Paiute
0.1
/100
|
#303
Tragic
$37,066
Hondurans
0.1
/100
|
#304
Tragic
$37,031
Inupiat
0.1
/100
|
#305
Tragic
$36,999
Immigrants | Haiti
0.0
/100
|
#306
Tragic
$36,849
Immigrants | Latin America
0.0
/100
|
#307
Tragic
$36,823
Fijians
0.0
/100
|
#308
Tragic
$36,690
Immigrants | Honduras
0.0
/100
|
#309
Tragic
$36,665
Ute
0.0
/100
|
#310
Tragic
$36,651
Chippewa
0.0
/100
|
#311
Tragic
$36,631

Demographics Similar to Immigrants from Germany by Per Capita Income

In terms of per capita income, the demographic groups most similar to Immigrants from Germany are Swedish ($45,750, a difference of 0.0%), Palestinian ($45,790, a difference of 0.090%), Zimbabwean ($45,804, a difference of 0.12%), European ($45,836, a difference of 0.19%), and Luxembourger ($45,663, a difference of 0.19%).
DemographicsRating | RankPer Capita Income
Immigrants | Ethiopia
92.7
/100
|
#120
Exceptional
$45,923
Canadians
92.2
/100
|
#121
Exceptional
$45,858
Moroccans
92.1
/100
|
#122
Exceptional
$45,854
Lebanese
92.0
/100
|
#123
Exceptional
$45,840
Europeans
92.0
/100
|
#124
Exceptional
$45,836
Zimbabweans
91.7
/100
|
#125
Exceptional
$45,804
Palestinians
91.6
/100
|
#126
Exceptional
$45,790
Immigrants | Germany
91.3
/100
|
#127
Exceptional
$45,751
Swedes
91.3
/100
|
#128
Exceptional
$45,750
Luxembourgers
90.4
/100
|
#129
Exceptional
$45,663
Arabs
90.4
/100
|
#130
Exceptional
$45,662
Immigrants | North Macedonia
90.0
/100
|
#131
Exceptional
$45,622
Jordanians
89.9
/100
|
#132
Excellent
$45,605
Pakistanis
89.7
/100
|
#133
Excellent
$45,587
Slovenes
89.6
/100
|
#134
Excellent
$45,581