Czech vs Immigrants from Germany Per Capita Income
COMPARE
Czech
Immigrants from Germany
Per Capita Income
Per Capita Income Comparison
Czechs
Immigrants from Germany
$44,595
PER CAPITA INCOME
74.1/ 100
METRIC RATING
147th/ 347
METRIC RANK
$45,751
PER CAPITA INCOME
91.3/ 100
METRIC RATING
127th/ 347
METRIC RANK
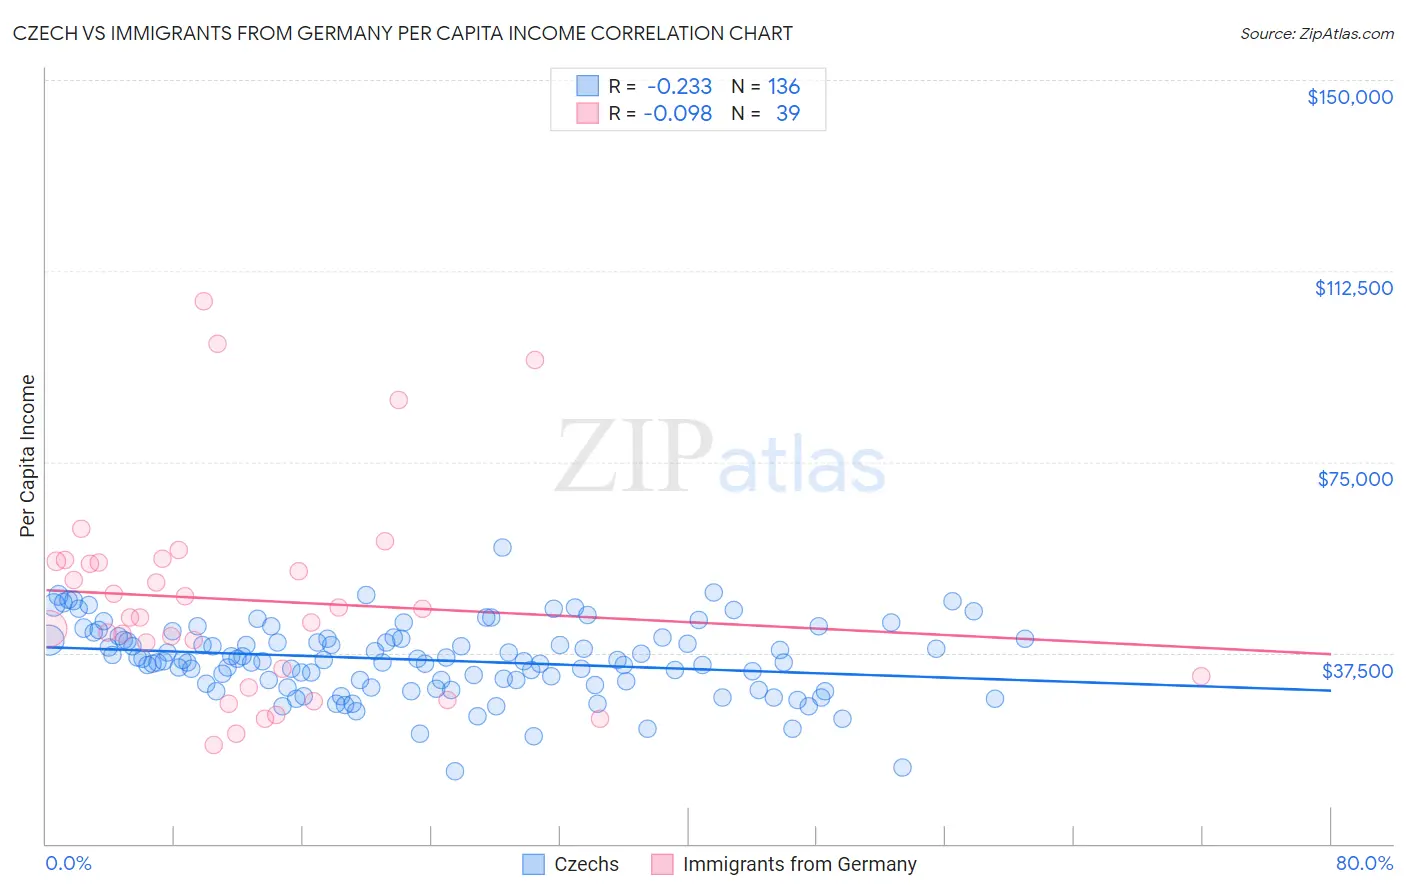
Czech vs Immigrants from Germany Per Capita Income Correlation Chart
The statistical analysis conducted on geographies consisting of 484,845,584 people shows a weak negative correlation between the proportion of Czechs and per capita income in the United States with a correlation coefficient (R) of -0.233 and weighted average of $44,595. Similarly, the statistical analysis conducted on geographies consisting of 463,898,714 people shows a slight negative correlation between the proportion of Immigrants from Germany and per capita income in the United States with a correlation coefficient (R) of -0.098 and weighted average of $45,751, a difference of 2.6%.
Per Capita Income Correlation Summary
| Measurement | Czech | Immigrants from Germany |
| Minimum | $14,339 | $19,389 |
| Maximum | $58,093 | $106,492 |
| Range | $43,754 | $87,103 |
| Mean | $36,126 | $47,817 |
| Median | $36,098 | $44,537 |
| Interquartile 25% (IQ1) | $31,633 | $32,967 |
| Interquartile 75% (IQ3) | $40,288 | $55,483 |
| Interquartile Range (IQR) | $8,655 | $22,516 |
| Standard Deviation (Sample) | $7,126 | $20,412 |
| Standard Deviation (Population) | $7,100 | $20,149 |
Demographics Similar to Czechs and Immigrants from Germany by Per Capita Income
In terms of per capita income, the demographic groups most similar to Czechs are Irish ($44,679, a difference of 0.19%), Immigrants from Afghanistan ($44,790, a difference of 0.44%), Icelander ($44,987, a difference of 0.88%), Immigrants from Uganda ($45,043, a difference of 1.0%), and Ugandan ($45,047, a difference of 1.0%). Similarly, the demographic groups most similar to Immigrants from Germany are Swedish ($45,750, a difference of 0.0%), Luxembourger ($45,663, a difference of 0.19%), Arab ($45,662, a difference of 0.20%), Immigrants from North Macedonia ($45,622, a difference of 0.28%), and Jordanian ($45,605, a difference of 0.32%).
| Demographics | Rating | Rank | Per Capita Income |
| Immigrants | Germany | 91.3 /100 | #127 | Exceptional $45,751 |
| Swedes | 91.3 /100 | #128 | Exceptional $45,750 |
| Luxembourgers | 90.4 /100 | #129 | Exceptional $45,663 |
| Arabs | 90.4 /100 | #130 | Exceptional $45,662 |
| Immigrants | North Macedonia | 90.0 /100 | #131 | Exceptional $45,622 |
| Jordanians | 89.9 /100 | #132 | Excellent $45,605 |
| Pakistanis | 89.7 /100 | #133 | Excellent $45,587 |
| Slovenes | 89.6 /100 | #134 | Excellent $45,581 |
| Hungarians | 87.9 /100 | #135 | Excellent $45,426 |
| Immigrants | Oceania | 85.2 /100 | #136 | Excellent $45,220 |
| Immigrants | Syria | 85.2 /100 | #137 | Excellent $45,218 |
| Assyrians/Chaldeans/Syriacs | 84.8 /100 | #138 | Excellent $45,195 |
| Basques | 83.2 /100 | #139 | Excellent $45,086 |
| Immigrants | Jordan | 82.9 /100 | #140 | Excellent $45,066 |
| Slavs | 82.6 /100 | #141 | Excellent $45,049 |
| Ugandans | 82.6 /100 | #142 | Excellent $45,047 |
| Immigrants | Uganda | 82.5 /100 | #143 | Excellent $45,043 |
| Icelanders | 81.6 /100 | #144 | Excellent $44,987 |
| Immigrants | Afghanistan | 78.0 /100 | #145 | Good $44,790 |
| Irish | 75.8 /100 | #146 | Good $44,679 |
| Czechs | 74.1 /100 | #147 | Good $44,595 |