Bahamian vs Ottawa Median Family Income
COMPARE
Bahamian
Ottawa
Median Family Income
Median Family Income Comparison
Bahamians
Ottawa
$82,631
MEDIAN FAMILY INCOME
0.0/ 100
METRIC RATING
323rd/ 347
METRIC RANK
$86,380
MEDIAN FAMILY INCOME
0.0/ 100
METRIC RATING
300th/ 347
METRIC RANK
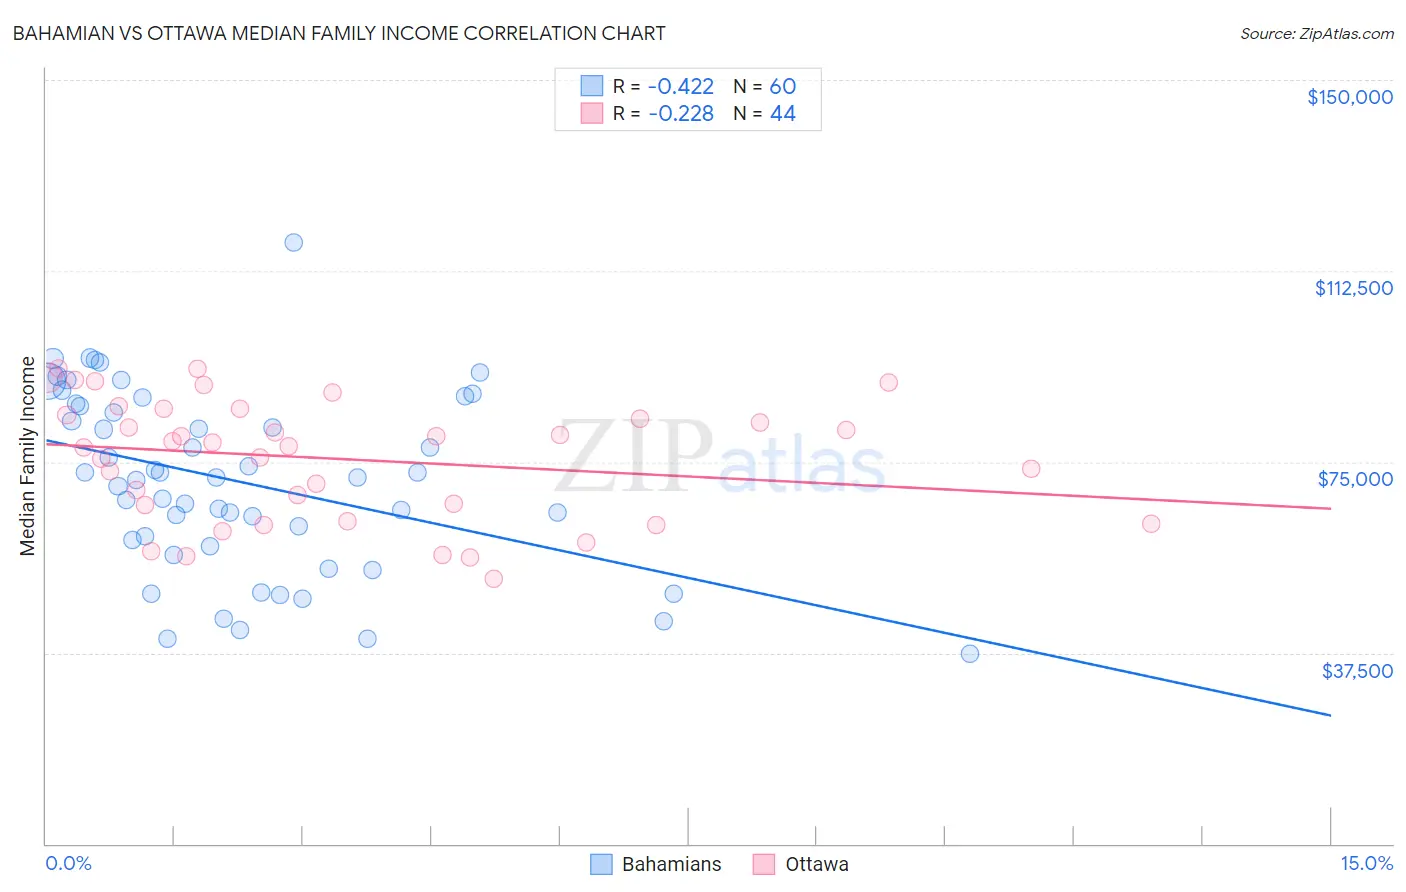
Bahamian vs Ottawa Median Family Income Correlation Chart
The statistical analysis conducted on geographies consisting of 112,596,489 people shows a moderate negative correlation between the proportion of Bahamians and median family income in the United States with a correlation coefficient (R) of -0.422 and weighted average of $82,631. Similarly, the statistical analysis conducted on geographies consisting of 49,943,189 people shows a weak negative correlation between the proportion of Ottawa and median family income in the United States with a correlation coefficient (R) of -0.228 and weighted average of $86,380, a difference of 4.5%.
Median Family Income Correlation Summary
| Measurement | Bahamian | Ottawa |
| Minimum | $37,231 | $52,125 |
| Maximum | $118,067 | $93,380 |
| Range | $80,836 | $41,255 |
| Mean | $71,118 | $75,597 |
| Median | $71,812 | $78,416 |
| Interquartile 25% (IQ1) | $59,044 | $64,972 |
| Interquartile 75% (IQ3) | $86,176 | $84,864 |
| Interquartile Range (IQR) | $27,132 | $19,892 |
| Standard Deviation (Sample) | $17,647 | $11,825 |
| Standard Deviation (Population) | $17,499 | $11,690 |
Similar Demographics by Median Family Income
Demographics Similar to Bahamians by Median Family Income
In terms of median family income, the demographic groups most similar to Bahamians are Creek ($82,560, a difference of 0.090%), Sioux ($82,386, a difference of 0.30%), Dominican ($82,888, a difference of 0.31%), Immigrants from Congo ($82,216, a difference of 0.51%), and Arapaho ($82,064, a difference of 0.69%).
| Demographics | Rating | Rank | Median Family Income |
| Immigrants | Haiti | 0.0 /100 | #316 | Tragic $84,018 |
| Yakama | 0.0 /100 | #317 | Tragic $83,932 |
| Immigrants | Mexico | 0.0 /100 | #318 | Tragic $83,639 |
| Immigrants | Honduras | 0.0 /100 | #319 | Tragic $83,618 |
| Seminole | 0.0 /100 | #320 | Tragic $83,354 |
| Immigrants | Caribbean | 0.0 /100 | #321 | Tragic $83,319 |
| Dominicans | 0.0 /100 | #322 | Tragic $82,888 |
| Bahamians | 0.0 /100 | #323 | Tragic $82,631 |
| Creek | 0.0 /100 | #324 | Tragic $82,560 |
| Sioux | 0.0 /100 | #325 | Tragic $82,386 |
| Immigrants | Congo | 0.0 /100 | #326 | Tragic $82,216 |
| Arapaho | 0.0 /100 | #327 | Tragic $82,064 |
| Blacks/African Americans | 0.0 /100 | #328 | Tragic $81,912 |
| Dutch West Indians | 0.0 /100 | #329 | Tragic $81,852 |
| Cheyenne | 0.0 /100 | #330 | Tragic $81,385 |
Demographics Similar to Ottawa by Median Family Income
In terms of median family income, the demographic groups most similar to Ottawa are Chippewa ($86,852, a difference of 0.55%), Colville ($85,792, a difference of 0.69%), Immigrants from Latin America ($86,989, a difference of 0.71%), Spanish American Indian ($85,728, a difference of 0.76%), and Hispanic or Latino ($85,647, a difference of 0.86%).
| Demographics | Rating | Rank | Median Family Income |
| Ute | 0.0 /100 | #293 | Tragic $87,596 |
| Fijians | 0.0 /100 | #294 | Tragic $87,387 |
| Yaqui | 0.0 /100 | #295 | Tragic $87,289 |
| Immigrants | Guatemala | 0.0 /100 | #296 | Tragic $87,191 |
| Cajuns | 0.0 /100 | #297 | Tragic $87,157 |
| Immigrants | Latin America | 0.0 /100 | #298 | Tragic $86,989 |
| Chippewa | 0.0 /100 | #299 | Tragic $86,852 |
| Ottawa | 0.0 /100 | #300 | Tragic $86,380 |
| Colville | 0.0 /100 | #301 | Tragic $85,792 |
| Spanish American Indians | 0.0 /100 | #302 | Tragic $85,728 |
| Hispanics or Latinos | 0.0 /100 | #303 | Tragic $85,647 |
| Mexicans | 0.0 /100 | #304 | Tragic $85,618 |
| Paiute | 0.0 /100 | #305 | Tragic $85,414 |
| Immigrants | Dominica | 0.0 /100 | #306 | Tragic $85,411 |
| Chickasaw | 0.0 /100 | #307 | Tragic $85,356 |