Asian vs Immigrants from Russia Median Family Income
COMPARE
Asian
Immigrants from Russia
Median Family Income
Median Family Income Comparison
Asians
Immigrants from Russia
$119,955
MEDIAN FAMILY INCOME
100.0/ 100
METRIC RATING
32nd/ 347
METRIC RANK
$116,942
MEDIAN FAMILY INCOME
99.9/ 100
METRIC RATING
46th/ 347
METRIC RANK
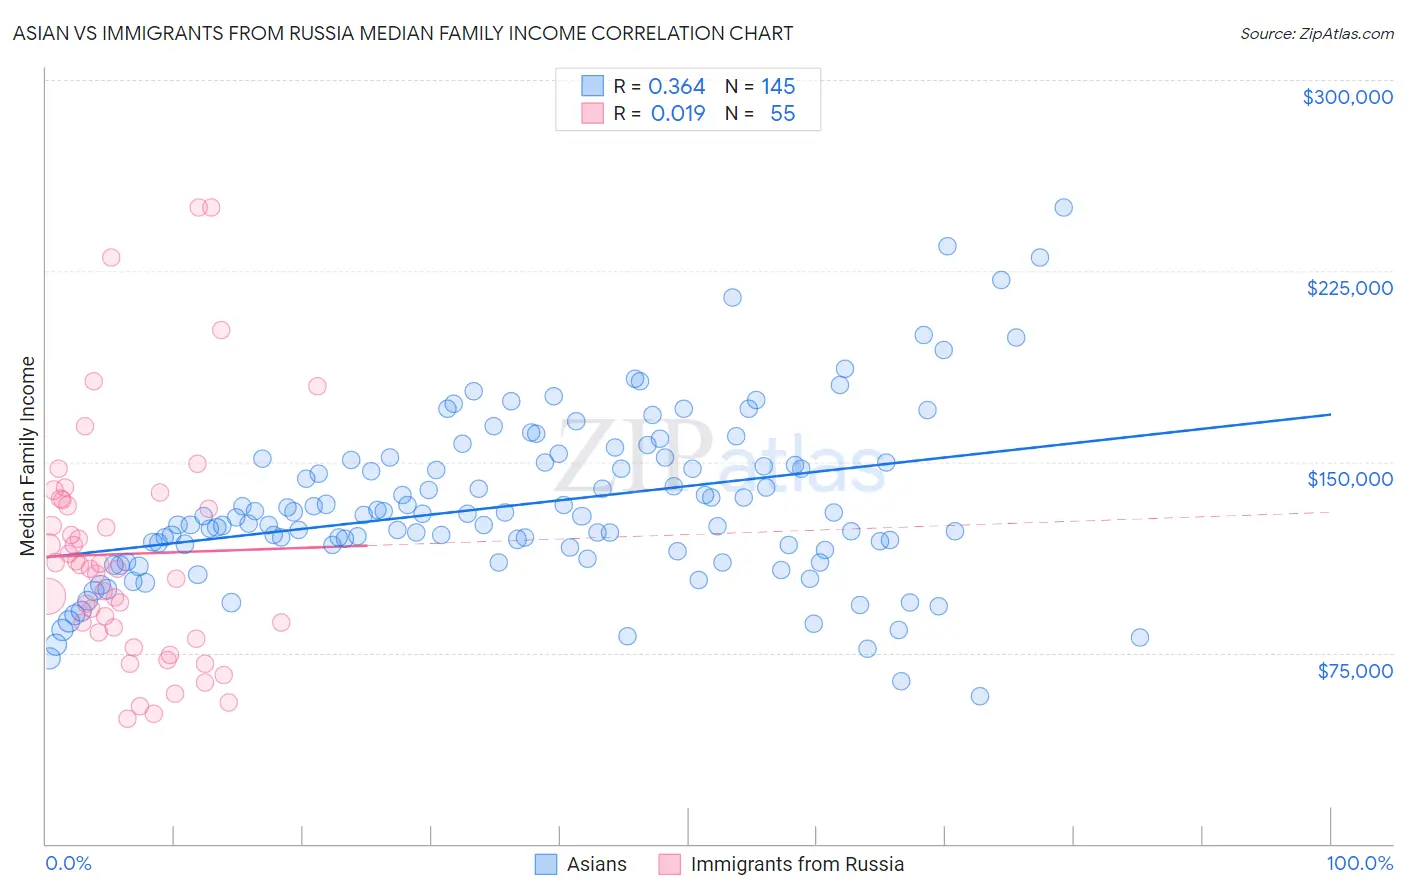
Asian vs Immigrants from Russia Median Family Income Correlation Chart
The statistical analysis conducted on geographies consisting of 549,758,807 people shows a mild positive correlation between the proportion of Asians and median family income in the United States with a correlation coefficient (R) of 0.364 and weighted average of $119,955. Similarly, the statistical analysis conducted on geographies consisting of 347,641,134 people shows no correlation between the proportion of Immigrants from Russia and median family income in the United States with a correlation coefficient (R) of 0.019 and weighted average of $116,942, a difference of 2.6%.
Median Family Income Correlation Summary
| Measurement | Asian | Immigrants from Russia |
| Minimum | $58,163 | $49,167 |
| Maximum | $250,001 | $250,001 |
| Range | $191,838 | $200,834 |
| Mean | $133,077 | $113,842 |
| Median | $128,500 | $107,999 |
| Interquartile 25% (IQ1) | $115,250 | $83,101 |
| Interquartile 75% (IQ3) | $150,323 | $134,951 |
| Interquartile Range (IQR) | $35,073 | $51,850 |
| Standard Deviation (Sample) | $33,384 | $46,059 |
| Standard Deviation (Population) | $33,269 | $45,638 |
Demographics Similar to Asians and Immigrants from Russia by Median Family Income
In terms of median family income, the demographic groups most similar to Asians are Immigrants from France ($120,076, a difference of 0.10%), Bhutanese ($119,800, a difference of 0.13%), Immigrants from Sri Lanka ($120,263, a difference of 0.26%), Latvian ($120,301, a difference of 0.29%), and Bolivian ($119,479, a difference of 0.40%). Similarly, the demographic groups most similar to Immigrants from Russia are Immigrants from Austria ($116,830, a difference of 0.10%), Immigrants from Greece ($117,344, a difference of 0.34%), Immigrants from South Africa ($116,286, a difference of 0.56%), Chinese ($116,188, a difference of 0.65%), and Cambodian ($117,780, a difference of 0.72%).
| Demographics | Rating | Rank | Median Family Income |
| Latvians | 100.0 /100 | #29 | Exceptional $120,301 |
| Immigrants | Sri Lanka | 100.0 /100 | #30 | Exceptional $120,263 |
| Immigrants | France | 100.0 /100 | #31 | Exceptional $120,076 |
| Asians | 100.0 /100 | #32 | Exceptional $119,955 |
| Bhutanese | 100.0 /100 | #33 | Exceptional $119,800 |
| Bolivians | 100.0 /100 | #34 | Exceptional $119,479 |
| Soviet Union | 100.0 /100 | #35 | Exceptional $119,262 |
| Israelis | 100.0 /100 | #36 | Exceptional $118,577 |
| Australians | 100.0 /100 | #37 | Exceptional $118,440 |
| Immigrants | Turkey | 100.0 /100 | #38 | Exceptional $118,325 |
| Immigrants | Asia | 100.0 /100 | #39 | Exceptional $118,291 |
| Immigrants | Lithuania | 100.0 /100 | #40 | Exceptional $118,053 |
| Estonians | 100.0 /100 | #41 | Exceptional $118,013 |
| Immigrants | Bolivia | 100.0 /100 | #42 | Exceptional $117,912 |
| Bulgarians | 100.0 /100 | #43 | Exceptional $117,818 |
| Cambodians | 100.0 /100 | #44 | Exceptional $117,780 |
| Immigrants | Greece | 99.9 /100 | #45 | Exceptional $117,344 |
| Immigrants | Russia | 99.9 /100 | #46 | Exceptional $116,942 |
| Immigrants | Austria | 99.9 /100 | #47 | Exceptional $116,830 |
| Immigrants | South Africa | 99.9 /100 | #48 | Exceptional $116,286 |
| Chinese | 99.9 /100 | #49 | Exceptional $116,188 |