Greek vs Paraguayan Median Earnings
COMPARE
Greek
Paraguayan
Median Earnings
Median Earnings Comparison
Greeks
Paraguayans
$51,164
MEDIAN EARNINGS
99.9/ 100
METRIC RATING
65th/ 347
METRIC RANK
$51,068
MEDIAN EARNINGS
99.9/ 100
METRIC RATING
68th/ 347
METRIC RANK
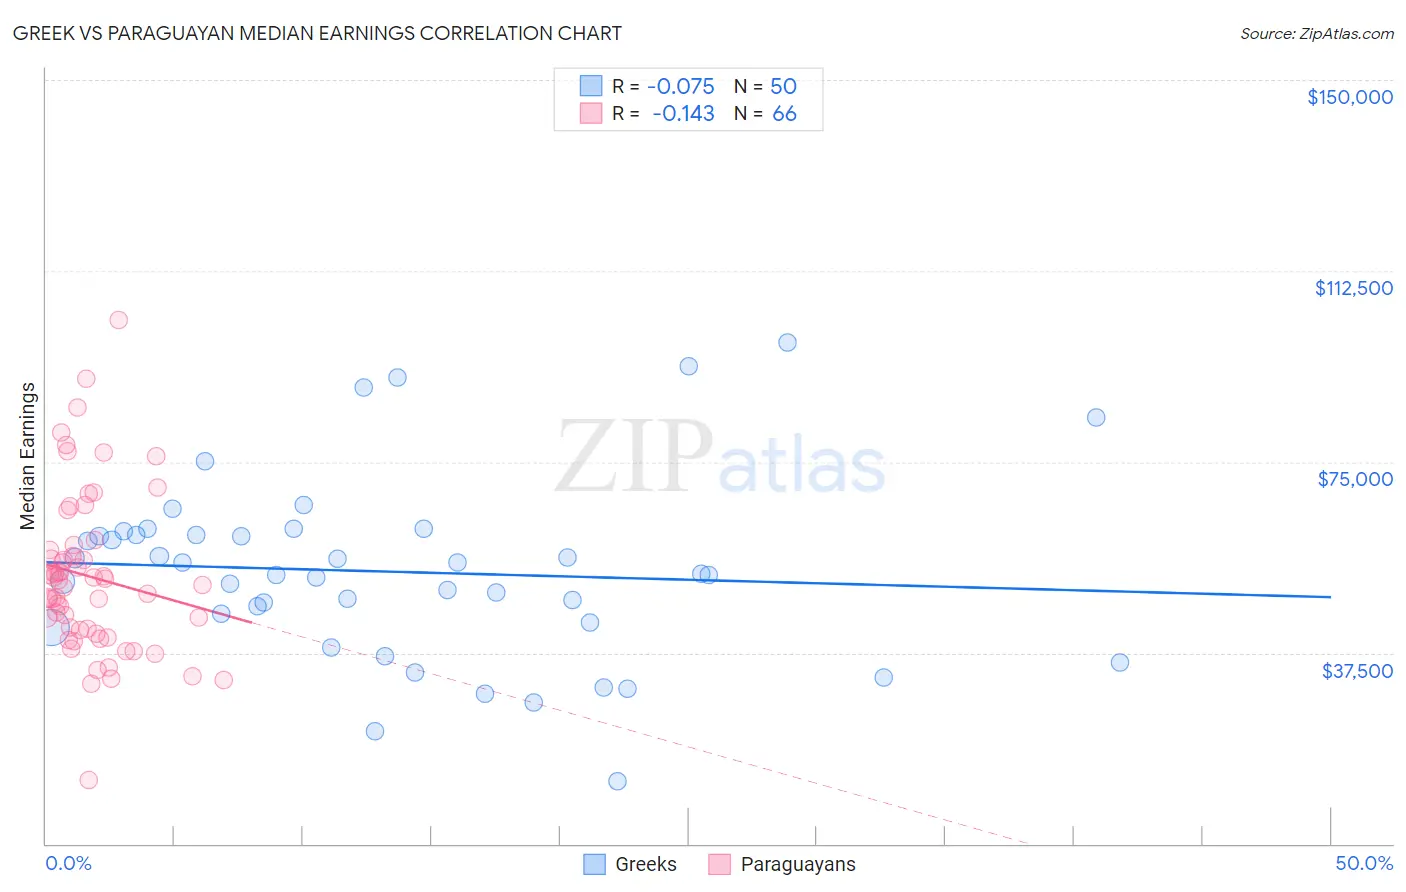
Greek vs Paraguayan Median Earnings Correlation Chart
The statistical analysis conducted on geographies consisting of 482,719,843 people shows a slight negative correlation between the proportion of Greeks and median earnings in the United States with a correlation coefficient (R) of -0.075 and weighted average of $51,164. Similarly, the statistical analysis conducted on geographies consisting of 95,085,692 people shows a poor negative correlation between the proportion of Paraguayans and median earnings in the United States with a correlation coefficient (R) of -0.143 and weighted average of $51,068, a difference of 0.19%.
Median Earnings Correlation Summary
| Measurement | Greek | Paraguayan |
| Minimum | $12,321 | $12,403 |
| Maximum | $98,462 | $102,750 |
| Range | $86,141 | $90,347 |
| Mean | $53,439 | $52,505 |
| Median | $52,981 | $51,405 |
| Interquartile 25% (IQ1) | $43,544 | $42,088 |
| Interquartile 75% (IQ3) | $60,703 | $57,643 |
| Interquartile Range (IQR) | $17,159 | $15,555 |
| Standard Deviation (Sample) | $17,942 | $15,766 |
| Standard Deviation (Population) | $17,762 | $15,646 |
Demographics Similar to Greeks and Paraguayans by Median Earnings
In terms of median earnings, the demographic groups most similar to Greeks are Afghan ($51,112, a difference of 0.10%), Immigrants from Spain ($51,092, a difference of 0.14%), New Zealander ($51,246, a difference of 0.16%), Mongolian ($51,038, a difference of 0.25%), and Immigrants from Bulgaria ($51,318, a difference of 0.30%). Similarly, the demographic groups most similar to Paraguayans are Immigrants from Spain ($51,092, a difference of 0.050%), Mongolian ($51,038, a difference of 0.060%), Afghan ($51,112, a difference of 0.090%), Lithuanian ($50,991, a difference of 0.15%), and Immigrants from Ukraine ($50,984, a difference of 0.16%).
| Demographics | Rating | Rank | Median Earnings |
| Immigrants | Pakistan | 99.9 /100 | #56 | Exceptional $51,693 |
| Immigrants | Eastern Europe | 99.9 /100 | #57 | Exceptional $51,624 |
| Immigrants | Bolivia | 99.9 /100 | #58 | Exceptional $51,605 |
| Immigrants | Croatia | 99.9 /100 | #59 | Exceptional $51,581 |
| Immigrants | Serbia | 99.9 /100 | #60 | Exceptional $51,557 |
| Immigrants | Latvia | 99.9 /100 | #61 | Exceptional $51,555 |
| Immigrants | Romania | 99.9 /100 | #62 | Exceptional $51,337 |
| Immigrants | Bulgaria | 99.9 /100 | #63 | Exceptional $51,318 |
| New Zealanders | 99.9 /100 | #64 | Exceptional $51,246 |
| Greeks | 99.9 /100 | #65 | Exceptional $51,164 |
| Afghans | 99.9 /100 | #66 | Exceptional $51,112 |
| Immigrants | Spain | 99.9 /100 | #67 | Exceptional $51,092 |
| Paraguayans | 99.9 /100 | #68 | Exceptional $51,068 |
| Mongolians | 99.8 /100 | #69 | Exceptional $51,038 |
| Lithuanians | 99.8 /100 | #70 | Exceptional $50,991 |
| Immigrants | Ukraine | 99.8 /100 | #71 | Exceptional $50,984 |
| Immigrants | Egypt | 99.8 /100 | #72 | Exceptional $50,901 |
| Immigrants | Netherlands | 99.8 /100 | #73 | Exceptional $50,818 |
| South Africans | 99.8 /100 | #74 | Exceptional $50,752 |
| Immigrants | Scotland | 99.8 /100 | #75 | Exceptional $50,741 |
| Immigrants | Italy | 99.7 /100 | #76 | Exceptional $50,581 |