Ghanaian vs Celtic Median Household Income
COMPARE
Ghanaian
Celtic
Median Household Income
Median Household Income Comparison
Ghanaians
Celtics
$83,582
MEDIAN HOUSEHOLD INCOME
27.4/ 100
METRIC RATING
194th/ 347
METRIC RANK
$83,193
MEDIAN HOUSEHOLD INCOME
22.7/ 100
METRIC RATING
205th/ 347
METRIC RANK
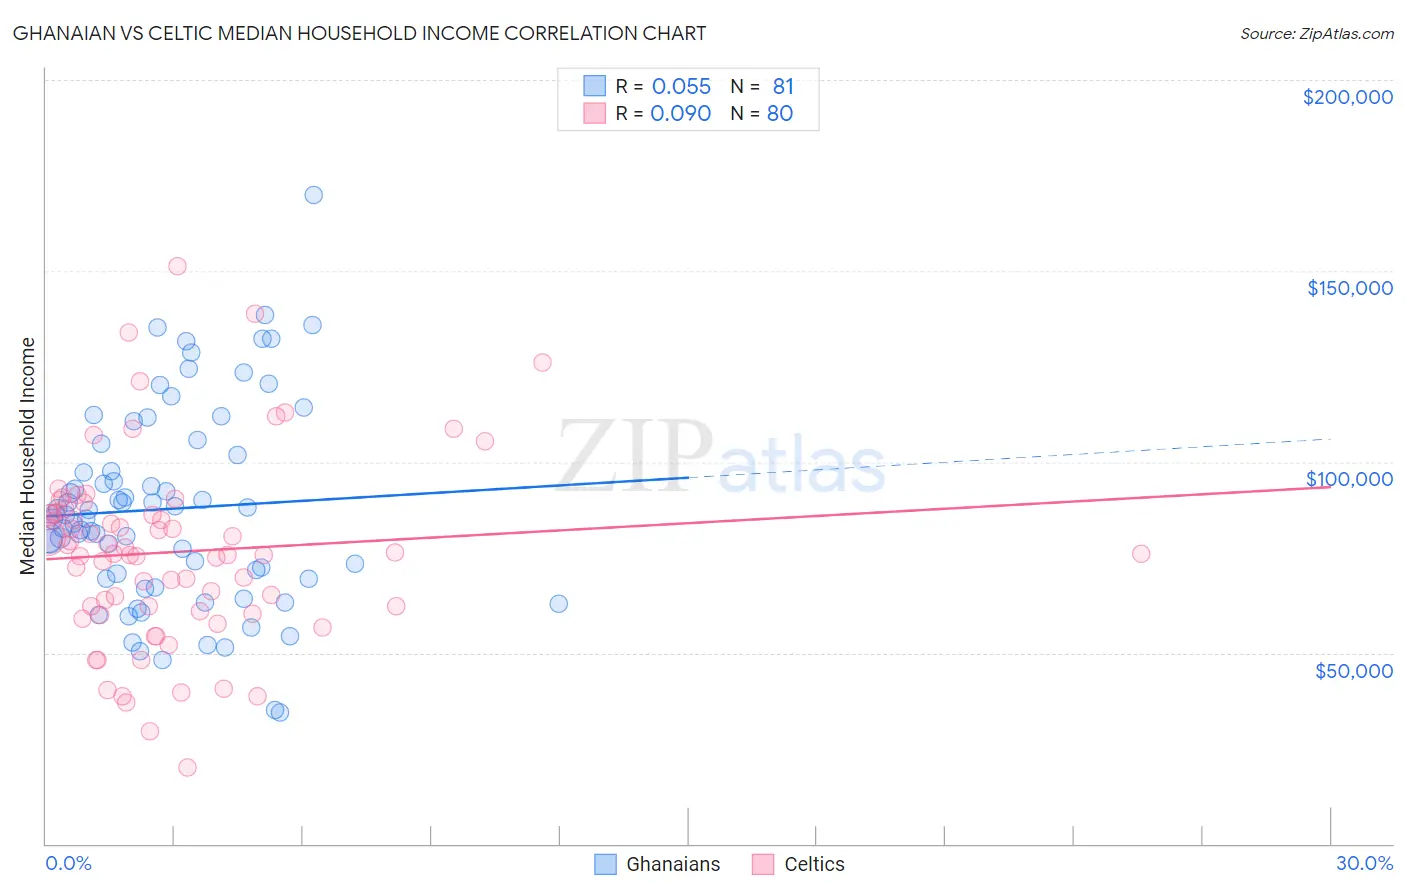
Ghanaian vs Celtic Median Household Income Correlation Chart
The statistical analysis conducted on geographies consisting of 190,498,021 people shows a slight positive correlation between the proportion of Ghanaians and median household income in the United States with a correlation coefficient (R) of 0.055 and weighted average of $83,582. Similarly, the statistical analysis conducted on geographies consisting of 168,842,689 people shows a slight positive correlation between the proportion of Celtics and median household income in the United States with a correlation coefficient (R) of 0.090 and weighted average of $83,193, a difference of 0.47%.
Median Household Income Correlation Summary
| Measurement | Ghanaian | Celtic |
| Minimum | $34,375 | $19,921 |
| Maximum | $169,773 | $151,161 |
| Range | $135,398 | $131,240 |
| Mean | $87,698 | $76,393 |
| Median | $86,122 | $75,866 |
| Interquartile 25% (IQ1) | $69,414 | $61,507 |
| Interquartile 75% (IQ3) | $103,226 | $86,536 |
| Interquartile Range (IQR) | $33,812 | $25,028 |
| Standard Deviation (Sample) | $26,089 | $24,415 |
| Standard Deviation (Population) | $25,928 | $24,262 |
Demographics Similar to Ghanaians and Celtics by Median Household Income
In terms of median household income, the demographic groups most similar to Ghanaians are Finnish ($83,607, a difference of 0.030%), Immigrants from Armenia ($83,555, a difference of 0.030%), Welsh ($83,628, a difference of 0.060%), French ($83,468, a difference of 0.14%), and Aleut ($83,446, a difference of 0.16%). Similarly, the demographic groups most similar to Celtics are Immigrants from Africa ($83,289, a difference of 0.11%), Immigrants from Cambodia ($83,304, a difference of 0.13%), Immigrants from Kenya ($83,068, a difference of 0.15%), Immigrants from Thailand ($83,327, a difference of 0.16%), and Tsimshian ($83,346, a difference of 0.18%).
| Demographics | Rating | Rank | Median Household Income |
| Immigrants | Colombia | 31.7 /100 | #189 | Fair $83,902 |
| Slovaks | 30.2 /100 | #190 | Fair $83,798 |
| Iraqis | 29.6 /100 | #191 | Fair $83,753 |
| Welsh | 28.0 /100 | #192 | Fair $83,628 |
| Finns | 27.7 /100 | #193 | Fair $83,607 |
| Ghanaians | 27.4 /100 | #194 | Fair $83,582 |
| Immigrants | Armenia | 27.0 /100 | #195 | Fair $83,555 |
| French | 26.0 /100 | #196 | Fair $83,468 |
| Aleuts | 25.7 /100 | #197 | Fair $83,446 |
| Japanese | 25.1 /100 | #198 | Fair $83,395 |
| Germans | 24.6 /100 | #199 | Fair $83,358 |
| Tsimshian | 24.5 /100 | #200 | Fair $83,346 |
| Spanish | 24.4 /100 | #201 | Fair $83,343 |
| Immigrants | Thailand | 24.3 /100 | #202 | Fair $83,327 |
| Immigrants | Cambodia | 24.0 /100 | #203 | Fair $83,304 |
| Immigrants | Africa | 23.8 /100 | #204 | Fair $83,289 |
| Celtics | 22.7 /100 | #205 | Fair $83,193 |
| Immigrants | Kenya | 21.3 /100 | #206 | Fair $83,068 |
| Dutch | 20.3 /100 | #207 | Fair $82,971 |
| French Canadians | 18.7 /100 | #208 | Poor $82,810 |
| Immigrants | Iraq | 16.7 /100 | #209 | Poor $82,594 |