French vs South African Median Household Income

COMPARE

French
Race
Ancestry
AfghanAfricanAlaska NativeAlaskan AthabascanAlbanianAleutAlsatianAmericanApacheArabArapahoArgentineanArmenianAssyrian/Chaldean/SyriacAustralianAustrianBahamianBangladeshiBarbadianBasqueBelgianBelizeanBermudanBhutaneseBlackfeetBolivianBrazilianBritishBritish West IndianBulgarianBurmeseCajunCambodianCanadianCape VerdeanCarpatho RusynCelticCentral AmericanCentral American IndianCherokeeCheyenneChickasawChileanChineseChippewaChoctawColombianColvilleComancheCosta RicanCreeCreekCroatianCrowCubanCypriotCzechCzechoslovakianDanishDelawareDominicanDutchDutch West IndianEastern EuropeanEcuadorianEgyptianEnglishEstonianEthiopianEuropeanFijianFilipinoFinnishFrenchFrench American IndianFrench CanadianGermanGerman RussianGhanaianGreekGuamanian/ChamorroGuatemalanGuyaneseHaitianHmongHonduranHopiHoumaHungarianIcelanderIndian (Asian)IndonesianInupiatIranianIraqiIrishIroquoisIsraeliItalianJamaicanJapaneseJordanianKenyanKiowaKoreanLaotianLatvianLebaneseLiberianLithuanianLumbeeLuxembourgerMacedonianMalaysianMalteseMarshalleseMenomineeMexicanMexican American IndianMongolianMoroccanNative HawaiianNavajoNepaleseNew ZealanderNicaraguanNigerianNorthern EuropeanNorwegianOkinawanOsageOttawaPaiutePakistaniPalestinianPanamanianParaguayanPennsylvania GermanPeruvianPimaPolishPortuguesePotawatomiPuebloPuerto RicanPuget Sound SalishRomanianRussianSalvadoranSamoanScandinavianScotch-IrishScottishSeminoleSenegaleseSerbianShoshoneSierra LeoneanSiouxSlavicSlovakSloveneSomaliSouth AmericanSouth American IndianSoviet UnionSpaniardSpanishSpanish AmericanSpanish American IndianSri LankanSubsaharan AfricanSudaneseSwedishSwissSyrianTaiwaneseThaiTlingit-HaidaTohono O'OdhamTonganTrinidadian and TobagonianTsimshianTurkishU.S. Virgin IslanderUgandanUkrainianUruguayanUteVenezuelanVietnameseWelshWest IndianYakamaYaquiYugoslavianYumanYup'ikZimbabwean
Immigration
NonimmigrantsImmigrantsAfghanistanAfricaAlbaniaArgentinaArmeniaAsiaAustraliaAustriaBahamasBangladeshBarbadosBelarusBelgiumBelizeBoliviaBosnia and HerzegovinaBrazilBulgariaBurma/MyanmarCabo VerdeCambodiaCameroonCanadaCaribbeanCentral AmericaChileChinaColombiaCongoCosta RicaCroatiaCubaCzechoslovakiaDenmarkDominicaDominican RepublicEastern AfricaEastern AsiaEastern EuropeEcuadorEgyptEl SalvadorEnglandEritreaEthiopiaEuropeFijiFranceGermanyGhanaGreeceGrenadaGuatemalaGuyanaHaitiHondurasHong KongHungaryIndiaIndonesiaIranIraqIrelandIsraelItalyJamaicaJapanJordanKazakhstanKenyaKoreaKuwaitLaosLatin AmericaLatviaLebanonLiberiaLithuaniaMalaysiaMexicoMicronesiaMiddle AfricaMoldovaMoroccoNepalNetherlandsNicaraguaNigeriaNorth AmericaNorth MacedoniaNorthern AfricaNorthern EuropeNorwayOceaniaPakistanPanamaPeruPhilippinesPolandPortugalRomaniaRussiaSaudi ArabiaScotlandSenegalSerbiaSierra LeoneSingaporeSomaliaSouth AfricaSouth AmericaSouth Central AsiaSouth Eastern AsiaSouthern EuropeSpainSri LankaSt. Vincent and the GrenadinesSudanSwedenSwitzerlandSyriaTaiwanThailandTrinidad and TobagoTurkeyUgandaUkraineUruguayUzbekistanVenezuelaVietnamWest IndiesWestern AfricaWestern AsiaWestern EuropeYemenZaireZimbabweAzores
South African
Race
Ancestry
AfghanAfricanAlaska NativeAlaskan AthabascanAlbanianAleutAlsatianAmericanApacheArabArapahoArgentineanArmenianAssyrian/Chaldean/SyriacAustralianAustrianBahamianBangladeshiBarbadianBasqueBelgianBelizeanBermudanBhutaneseBlackfeetBolivianBrazilianBritishBritish West IndianBulgarianBurmeseCajunCambodianCanadianCape VerdeanCarpatho RusynCelticCentral AmericanCentral American IndianCherokeeCheyenneChickasawChileanChineseChippewaChoctawColombianColvilleComancheCosta RicanCreeCreekCroatianCrowCubanCypriotCzechCzechoslovakianDanishDelawareDominicanDutchDutch West IndianEastern EuropeanEcuadorianEgyptianEnglishEstonianEthiopianEuropeanFijianFilipinoFinnishFrench American IndianFrench CanadianGermanGerman RussianGhanaianGreekGuamanian/ChamorroGuatemalanGuyaneseHaitianHmongHonduranHopiHoumaHungarianIcelanderIndian (Asian)IndonesianInupiatIranianIraqiIrishIroquoisIsraeliItalianJamaicanJapaneseJordanianKenyanKiowaKoreanLaotianLatvianLebaneseLiberianLithuanianLumbeeLuxembourgerMacedonianMalaysianMalteseMarshalleseMenomineeMexicanMexican American IndianMongolianMoroccanNative HawaiianNavajoNepaleseNew ZealanderNicaraguanNigerianNorthern EuropeanNorwegianOkinawanOsageOttawaPaiutePakistaniPalestinianPanamanianParaguayanPennsylvania GermanPeruvianPimaPolishPortuguesePotawatomiPuebloPuerto RicanPuget Sound SalishRomanianRussianSalvadoranSamoanScandinavianScotch-IrishScottishSeminoleSenegaleseSerbianShoshoneSierra LeoneanSiouxSlavicSlovakSloveneSomaliSouth AfricanSouth AmericanSouth American IndianSoviet UnionSpaniardSpanishSpanish AmericanSpanish American IndianSri LankanSubsaharan AfricanSudaneseSwedishSwissSyrianTaiwaneseThaiTlingit-HaidaTohono O'OdhamTonganTrinidadian and TobagonianTsimshianTurkishU.S. Virgin IslanderUgandanUkrainianUruguayanUteVenezuelanVietnameseWelshWest IndianYakamaYaquiYugoslavianYumanYup'ikZimbabwean
Immigration
NonimmigrantsImmigrantsAfghanistanAfricaAlbaniaArgentinaArmeniaAsiaAustraliaAustriaBahamasBangladeshBarbadosBelarusBelgiumBelizeBoliviaBosnia and HerzegovinaBrazilBulgariaBurma/MyanmarCabo VerdeCambodiaCameroonCanadaCaribbeanCentral AmericaChileChinaColombiaCongoCosta RicaCroatiaCubaCzechoslovakiaDenmarkDominicaDominican RepublicEastern AfricaEastern AsiaEastern EuropeEcuadorEgyptEl SalvadorEnglandEritreaEthiopiaEuropeFijiFranceGermanyGhanaGreeceGrenadaGuatemalaGuyanaHaitiHondurasHong KongHungaryIndiaIndonesiaIranIraqIrelandIsraelItalyJamaicaJapanJordanKazakhstanKenyaKoreaKuwaitLaosLatin AmericaLatviaLebanonLiberiaLithuaniaMalaysiaMexicoMicronesiaMiddle AfricaMoldovaMoroccoNepalNetherlandsNicaraguaNigeriaNorth AmericaNorth MacedoniaNorthern AfricaNorthern EuropeNorwayOceaniaPakistanPanamaPeruPhilippinesPolandPortugalRomaniaRussiaSaudi ArabiaScotlandSenegalSerbiaSierra LeoneSingaporeSomaliaSouth AfricaSouth AmericaSouth Central AsiaSouth Eastern AsiaSouthern EuropeSpainSri LankaSt. Vincent and the GrenadinesSudanSwedenSwitzerlandSyriaTaiwanThailandTrinidad and TobagoTurkeyUgandaUkraineUruguayUzbekistanVenezuelaVietnamWest IndiesWestern AfricaWestern AsiaWestern EuropeYemenZaireZimbabweAzores
Median Household Income
Income
Poverty
Unemployment
Labor Participation
Family Structure
Vehicle Availability
Education Level
Disability

Median Household Income Comparison

French

South Africans

Fair
Exceptional
$83,468
MEDIAN HOUSEHOLD INCOME
26.0/ 100
METRIC RATING
196th/ 347
METRIC RANK
$93,379
MEDIAN HOUSEHOLD INCOME
99.5/ 100
METRIC RATING
76th/ 347
METRIC RANK

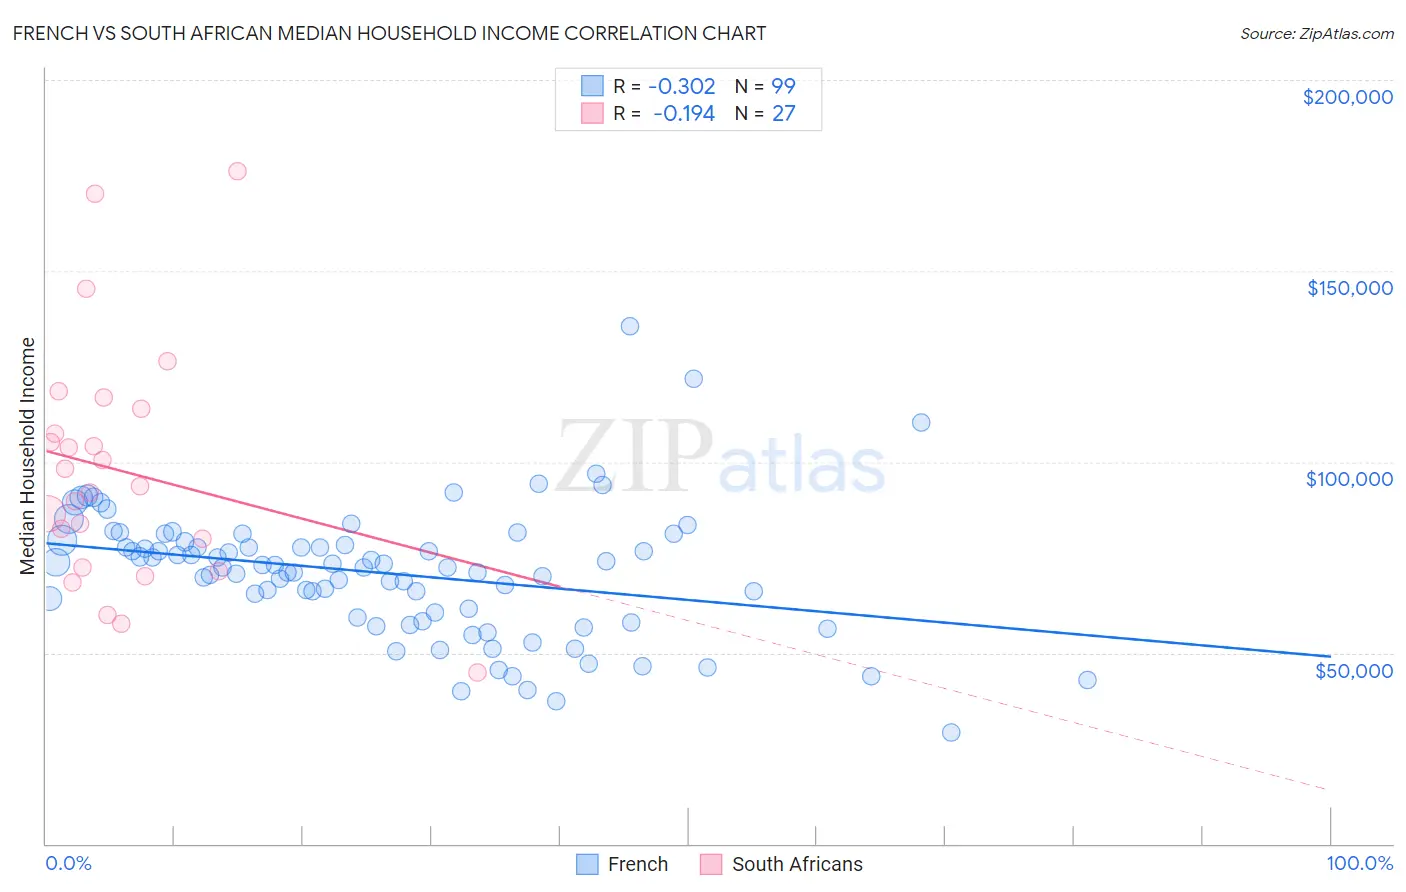
French vs South African Median Household Income Correlation Chart

The statistical analysis conducted on geographies consisting of 571,286,063 people shows a mild negative correlation between the proportion of French and median household income in the United States with a correlation coefficient (R) of -0.302 and weighted average of $83,468. Similarly, the statistical analysis conducted on geographies consisting of 182,537,527 people shows a poor negative correlation between the proportion of South Africans and median household income in the United States with a correlation coefficient (R) of -0.194 and weighted average of $93,379, a difference of 11.9%.
French vs South African Median Household Income

Median Household Income Correlation Summary

MeasurementFrenchSouth African
Minimum$29,263$45,000
Maximum$135,625$176,103
Range$106,362$131,103
Mean$70,877$97,725
Median$72,372$93,672
Interquartile 25% (IQ1)$59,090$72,324
Interquartile 75% (IQ3)$79,064$113,958
Interquartile Range (IQR)$19,974$41,634
Standard Deviation (Sample)$17,004$31,372
Standard Deviation (Population)$16,918$30,786

Similar Demographics by Median Household Income

Demographics Similar to French by Median Household Income

In terms of median household income, the demographic groups most similar to French are Aleut ($83,446, a difference of 0.030%), Japanese ($83,395, a difference of 0.090%), Immigrants from Armenia ($83,555, a difference of 0.10%), German ($83,358, a difference of 0.13%), and Ghanaian ($83,582, a difference of 0.14%).
DemographicsRating | RankMedian Household Income
Immigrants | Colombia
31.7
/100
|
#189
Fair
$83,902
Slovaks
30.2
/100
|
#190
Fair
$83,798
Iraqis
29.6
/100
|
#191
Fair
$83,753
Welsh
28.0
/100
|
#192
Fair
$83,628
Finns
27.7
/100
|
#193
Fair
$83,607
Ghanaians
27.4
/100
|
#194
Fair
$83,582
Immigrants | Armenia
27.0
/100
|
#195
Fair
$83,555
French
26.0
/100
|
#196
Fair
$83,468
Aleuts
25.7
/100
|
#197
Fair
$83,446
Japanese
25.1
/100
|
#198
Fair
$83,395
Germans
24.6
/100
|
#199
Fair
$83,358
Tsimshian
24.5
/100
|
#200
Fair
$83,346
Spanish
24.4
/100
|
#201
Fair
$83,343
Immigrants | Thailand
24.3
/100
|
#202
Fair
$83,327
Immigrants | Cambodia
24.0
/100
|
#203
Fair
$83,304

Demographics Similar to South Africans by Median Household Income

In terms of median household income, the demographic groups most similar to South Africans are Immigrants from Afghanistan ($93,375, a difference of 0.0%), Immigrants from Italy ($93,465, a difference of 0.090%), Immigrants from Latvia ($93,602, a difference of 0.24%), Immigrants from Bulgaria ($93,148, a difference of 0.25%), and Sri Lankan ($93,093, a difference of 0.31%).
DemographicsRating | RankMedian Household Income
Argentineans
99.7
/100
|
#69
Exceptional
$93,960
Immigrants | Fiji
99.7
/100
|
#70
Exceptional
$93,933
Immigrants | Philippines
99.6
/100
|
#71
Exceptional
$93,899
Lithuanians
99.6
/100
|
#72
Exceptional
$93,852
Immigrants | Egypt
99.6
/100
|
#73
Exceptional
$93,700
Immigrants | Latvia
99.6
/100
|
#74
Exceptional
$93,602
Immigrants | Italy
99.5
/100
|
#75
Exceptional
$93,465
South Africans
99.5
/100
|
#76
Exceptional
$93,379
Immigrants | Afghanistan
99.5
/100
|
#77
Exceptional
$93,375
Immigrants | Bulgaria
99.4
/100
|
#78
Exceptional
$93,148
Sri Lankans
99.4
/100
|
#79
Exceptional
$93,093
Tongans
99.4
/100
|
#80
Exceptional
$93,076
Immigrants | Eastern Europe
99.4
/100
|
#81
Exceptional
$93,051
Immigrants | Spain
99.3
/100
|
#82
Exceptional
$92,732
Italians
99.1
/100
|
#83
Exceptional
$92,475