French vs South African Currently Married
COMPARE
French
South African
Currently Married
Currently Married Comparison
French
South Africans
48.4%
CURRENTLY MARRIED
98.6/ 100
METRIC RATING
58th/ 347
METRIC RANK
47.6%
CURRENTLY MARRIED
90.5/ 100
METRIC RATING
114th/ 347
METRIC RANK
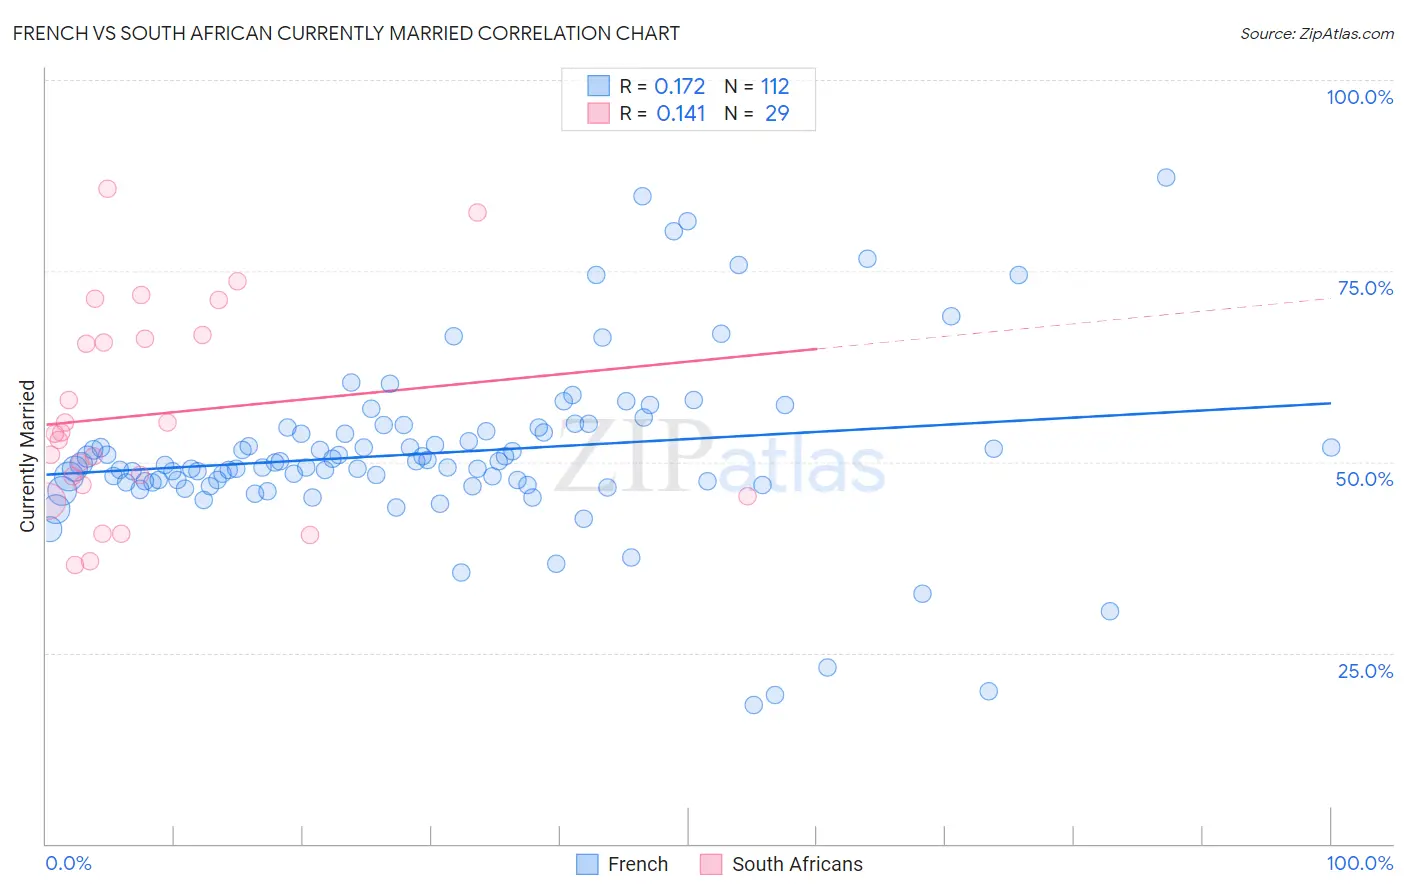
French vs South African Currently Married Correlation Chart
The statistical analysis conducted on geographies consisting of 572,298,467 people shows a poor positive correlation between the proportion of French and percentage of population currently married in the United States with a correlation coefficient (R) of 0.172 and weighted average of 48.4%. Similarly, the statistical analysis conducted on geographies consisting of 182,588,333 people shows a poor positive correlation between the proportion of South Africans and percentage of population currently married in the United States with a correlation coefficient (R) of 0.141 and weighted average of 47.6%, a difference of 1.8%.
Currently Married Correlation Summary
| Measurement | French | South African |
| Minimum | 18.1% | 36.5% |
| Maximum | 87.2% | 85.8% |
| Range | 69.1% | 49.3% |
| Mean | 51.2% | 56.2% |
| Median | 49.6% | 53.7% |
| Interquartile 25% (IQ1) | 47.3% | 46.2% |
| Interquartile 75% (IQ3) | 54.2% | 66.3% |
| Interquartile Range (IQR) | 6.9% | 20.1% |
| Standard Deviation (Sample) | 11.4% | 13.4% |
| Standard Deviation (Population) | 11.3% | 13.2% |
Similar Demographics by Currently Married
Demographics Similar to French by Currently Married
In terms of currently married, the demographic groups most similar to French are Immigrants from Ireland (48.4%, a difference of 0.030%), Immigrants from Netherlands (48.5%, a difference of 0.040%), Immigrants from Romania (48.4%, a difference of 0.040%), Romanian (48.4%, a difference of 0.050%), and Asian (48.4%, a difference of 0.060%).
| Demographics | Rating | Rank | Currently Married |
| Whites/Caucasians | 99.0 /100 | #51 | Exceptional 48.6% |
| Russians | 98.9 /100 | #52 | Exceptional 48.6% |
| Immigrants | Austria | 98.8 /100 | #53 | Exceptional 48.5% |
| Immigrants | Moldova | 98.7 /100 | #54 | Exceptional 48.5% |
| Immigrants | North Macedonia | 98.7 /100 | #55 | Exceptional 48.5% |
| Latvians | 98.7 /100 | #56 | Exceptional 48.5% |
| Immigrants | Netherlands | 98.6 /100 | #57 | Exceptional 48.5% |
| French | 98.6 /100 | #58 | Exceptional 48.4% |
| Immigrants | Ireland | 98.5 /100 | #59 | Exceptional 48.4% |
| Immigrants | Romania | 98.5 /100 | #60 | Exceptional 48.4% |
| Romanians | 98.5 /100 | #61 | Exceptional 48.4% |
| Asians | 98.5 /100 | #62 | Exceptional 48.4% |
| Slavs | 98.3 /100 | #63 | Exceptional 48.4% |
| Immigrants | Czechoslovakia | 98.3 /100 | #64 | Exceptional 48.4% |
| Ukrainians | 98.3 /100 | #65 | Exceptional 48.4% |
Demographics Similar to South Africans by Currently Married
In terms of currently married, the demographic groups most similar to South Africans are Immigrants from Indonesia (47.6%, a difference of 0.0%), Palestinian (47.6%, a difference of 0.010%), Immigrants from Denmark (47.6%, a difference of 0.030%), Puget Sound Salish (47.6%, a difference of 0.030%), and Immigrants from Philippines (47.6%, a difference of 0.030%).
| Demographics | Rating | Rank | Currently Married |
| Immigrants | Italy | 92.9 /100 | #107 | Exceptional 47.7% |
| Tsimshian | 92.4 /100 | #108 | Exceptional 47.7% |
| Immigrants | Egypt | 92.3 /100 | #109 | Exceptional 47.7% |
| Immigrants | Russia | 92.0 /100 | #110 | Exceptional 47.7% |
| Immigrants | Hungary | 91.2 /100 | #111 | Exceptional 47.6% |
| Immigrants | Western Europe | 91.1 /100 | #112 | Exceptional 47.6% |
| Immigrants | Denmark | 90.9 /100 | #113 | Exceptional 47.6% |
| South Africans | 90.5 /100 | #114 | Exceptional 47.6% |
| Immigrants | Indonesia | 90.5 /100 | #115 | Exceptional 47.6% |
| Palestinians | 90.4 /100 | #116 | Exceptional 47.6% |
| Puget Sound Salish | 90.3 /100 | #117 | Exceptional 47.6% |
| Immigrants | Philippines | 90.2 /100 | #118 | Exceptional 47.6% |
| Australians | 90.2 /100 | #119 | Exceptional 47.6% |
| Syrians | 88.9 /100 | #120 | Excellent 47.5% |
| Immigrants | Croatia | 88.6 /100 | #121 | Excellent 47.5% |