French vs Immigrants from Guatemala Median Household Income

COMPARE

French
Race
Ancestry
AfghanAfricanAlaska NativeAlaskan AthabascanAlbanianAleutAlsatianAmericanApacheArabArapahoArgentineanArmenianAssyrian/Chaldean/SyriacAustralianAustrianBahamianBangladeshiBarbadianBasqueBelgianBelizeanBermudanBhutaneseBlackfeetBolivianBrazilianBritishBritish West IndianBulgarianBurmeseCajunCambodianCanadianCape VerdeanCarpatho RusynCelticCentral AmericanCentral American IndianCherokeeCheyenneChickasawChileanChineseChippewaChoctawColombianColvilleComancheCosta RicanCreeCreekCroatianCrowCubanCypriotCzechCzechoslovakianDanishDelawareDominicanDutchDutch West IndianEastern EuropeanEcuadorianEgyptianEnglishEstonianEthiopianEuropeanFijianFilipinoFinnishFrenchFrench American IndianFrench CanadianGermanGerman RussianGhanaianGreekGuamanian/ChamorroGuatemalanGuyaneseHaitianHmongHonduranHopiHoumaHungarianIcelanderIndian (Asian)IndonesianInupiatIranianIraqiIrishIroquoisIsraeliItalianJamaicanJapaneseJordanianKenyanKiowaKoreanLaotianLatvianLebaneseLiberianLithuanianLumbeeLuxembourgerMacedonianMalaysianMalteseMarshalleseMenomineeMexicanMexican American IndianMongolianMoroccanNative HawaiianNavajoNepaleseNew ZealanderNicaraguanNigerianNorthern EuropeanNorwegianOkinawanOsageOttawaPaiutePakistaniPalestinianPanamanianParaguayanPennsylvania GermanPeruvianPimaPolishPortuguesePotawatomiPuebloPuerto RicanPuget Sound SalishRomanianRussianSalvadoranSamoanScandinavianScotch-IrishScottishSeminoleSenegaleseSerbianShoshoneSierra LeoneanSiouxSlavicSlovakSloveneSomaliSouth AfricanSouth AmericanSouth American IndianSoviet UnionSpaniardSpanishSpanish AmericanSpanish American IndianSri LankanSubsaharan AfricanSudaneseSwedishSwissSyrianTaiwaneseThaiTlingit-HaidaTohono O'OdhamTonganTrinidadian and TobagonianTsimshianTurkishU.S. Virgin IslanderUgandanUkrainianUruguayanUteVenezuelanVietnameseWelshWest IndianYakamaYaquiYugoslavianYumanYup'ikZimbabwean
Immigration
NonimmigrantsImmigrantsAfghanistanAfricaAlbaniaArgentinaArmeniaAsiaAustraliaAustriaBahamasBangladeshBarbadosBelarusBelgiumBelizeBoliviaBosnia and HerzegovinaBrazilBulgariaBurma/MyanmarCabo VerdeCambodiaCameroonCanadaCaribbeanCentral AmericaChileChinaColombiaCongoCosta RicaCroatiaCubaCzechoslovakiaDenmarkDominicaDominican RepublicEastern AfricaEastern AsiaEastern EuropeEcuadorEgyptEl SalvadorEnglandEritreaEthiopiaEuropeFijiFranceGermanyGhanaGreeceGrenadaGuyanaHaitiHondurasHong KongHungaryIndiaIndonesiaIranIraqIrelandIsraelItalyJamaicaJapanJordanKazakhstanKenyaKoreaKuwaitLaosLatin AmericaLatviaLebanonLiberiaLithuaniaMalaysiaMexicoMicronesiaMiddle AfricaMoldovaMoroccoNepalNetherlandsNicaraguaNigeriaNorth AmericaNorth MacedoniaNorthern AfricaNorthern EuropeNorwayOceaniaPakistanPanamaPeruPhilippinesPolandPortugalRomaniaRussiaSaudi ArabiaScotlandSenegalSerbiaSierra LeoneSingaporeSomaliaSouth AfricaSouth AmericaSouth Central AsiaSouth Eastern AsiaSouthern EuropeSpainSri LankaSt. Vincent and the GrenadinesSudanSwedenSwitzerlandSyriaTaiwanThailandTrinidad and TobagoTurkeyUgandaUkraineUruguayUzbekistanVenezuelaVietnamWest IndiesWestern AfricaWestern AsiaWestern EuropeYemenZaireZimbabweAzores
Immigrants from Guatemala
Race
Ancestry
AfghanAfricanAlaska NativeAlaskan AthabascanAlbanianAleutAlsatianAmericanApacheArabArapahoArgentineanArmenianAssyrian/Chaldean/SyriacAustralianAustrianBahamianBangladeshiBarbadianBasqueBelgianBelizeanBermudanBhutaneseBlackfeetBolivianBrazilianBritishBritish West IndianBulgarianBurmeseCajunCambodianCanadianCape VerdeanCarpatho RusynCelticCentral AmericanCentral American IndianCherokeeCheyenneChickasawChileanChineseChippewaChoctawColombianColvilleComancheCosta RicanCreeCreekCroatianCrowCubanCypriotCzechCzechoslovakianDanishDelawareDominicanDutchDutch West IndianEastern EuropeanEcuadorianEgyptianEnglishEstonianEthiopianEuropeanFijianFilipinoFinnishFrench American IndianFrench CanadianGermanGerman RussianGhanaianGreekGuamanian/ChamorroGuatemalanGuyaneseHaitianHmongHonduranHopiHoumaHungarianIcelanderIndian (Asian)IndonesianInupiatIranianIraqiIrishIroquoisIsraeliItalianJamaicanJapaneseJordanianKenyanKiowaKoreanLaotianLatvianLebaneseLiberianLithuanianLumbeeLuxembourgerMacedonianMalaysianMalteseMarshalleseMenomineeMexicanMexican American IndianMongolianMoroccanNative HawaiianNavajoNepaleseNew ZealanderNicaraguanNigerianNorthern EuropeanNorwegianOkinawanOsageOttawaPaiutePakistaniPalestinianPanamanianParaguayanPennsylvania GermanPeruvianPimaPolishPortuguesePotawatomiPuebloPuerto RicanPuget Sound SalishRomanianRussianSalvadoranSamoanScandinavianScotch-IrishScottishSeminoleSenegaleseSerbianShoshoneSierra LeoneanSiouxSlavicSlovakSloveneSomaliSouth AfricanSouth AmericanSouth American IndianSoviet UnionSpaniardSpanishSpanish AmericanSpanish American IndianSri LankanSubsaharan AfricanSudaneseSwedishSwissSyrianTaiwaneseThaiTlingit-HaidaTohono O'OdhamTonganTrinidadian and TobagonianTsimshianTurkishU.S. Virgin IslanderUgandanUkrainianUruguayanUteVenezuelanVietnameseWelshWest IndianYakamaYaquiYugoslavianYumanYup'ikZimbabwean
Immigration
NonimmigrantsImmigrantsAfghanistanAfricaAlbaniaArgentinaArmeniaAsiaAustraliaAustriaBahamasBangladeshBarbadosBelarusBelgiumBelizeBoliviaBosnia and HerzegovinaBrazilBulgariaBurma/MyanmarCabo VerdeCambodiaCameroonCanadaCaribbeanCentral AmericaChileChinaColombiaCongoCosta RicaCroatiaCubaCzechoslovakiaDenmarkDominicaDominican RepublicEastern AfricaEastern AsiaEastern EuropeEcuadorEgyptEl SalvadorEnglandEritreaEthiopiaEuropeFijiFranceGermanyGhanaGreeceGrenadaGuatemalaGuyanaHaitiHondurasHong KongHungaryIndiaIndonesiaIranIraqIrelandIsraelItalyJamaicaJapanJordanKazakhstanKenyaKoreaKuwaitLaosLatin AmericaLatviaLebanonLiberiaLithuaniaMalaysiaMexicoMicronesiaMiddle AfricaMoldovaMoroccoNepalNetherlandsNicaraguaNigeriaNorth AmericaNorth MacedoniaNorthern AfricaNorthern EuropeNorwayOceaniaPakistanPanamaPeruPhilippinesPolandPortugalRomaniaRussiaSaudi ArabiaScotlandSenegalSerbiaSierra LeoneSingaporeSomaliaSouth AfricaSouth AmericaSouth Central AsiaSouth Eastern AsiaSouthern EuropeSpainSri LankaSt. Vincent and the GrenadinesSudanSwedenSwitzerlandSyriaTaiwanThailandTrinidad and TobagoTurkeyUgandaUkraineUruguayUzbekistanVenezuelaVietnamWest IndiesWestern AfricaWestern AsiaWestern EuropeYemenZaireZimbabweAzores
Median Household Income
Income
Poverty
Unemployment
Labor Participation
Family Structure
Vehicle Availability
Education Level
Disability

Median Household Income Comparison

French

Immigrants from Guatemala

Fair
Tragic
$83,468
MEDIAN HOUSEHOLD INCOME
26.0/ 100
METRIC RATING
196th/ 347
METRIC RANK
$75,123
MEDIAN HOUSEHOLD INCOME
0.2/ 100
METRIC RATING
279th/ 347
METRIC RANK

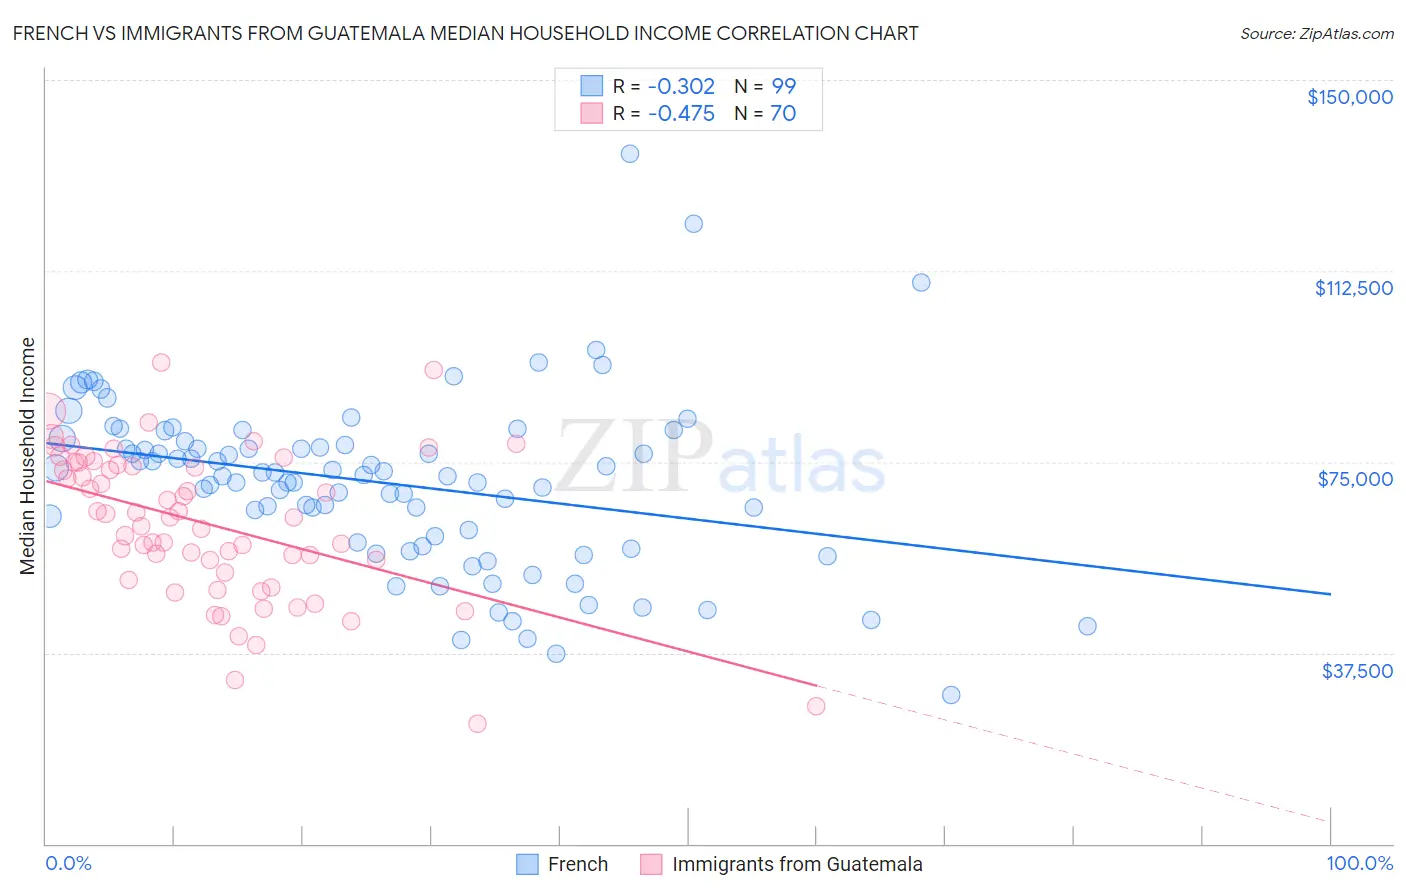
French vs Immigrants from Guatemala Median Household Income Correlation Chart

The statistical analysis conducted on geographies consisting of 571,286,063 people shows a mild negative correlation between the proportion of French and median household income in the United States with a correlation coefficient (R) of -0.302 and weighted average of $83,468. Similarly, the statistical analysis conducted on geographies consisting of 377,100,109 people shows a moderate negative correlation between the proportion of Immigrants from Guatemala and median household income in the United States with a correlation coefficient (R) of -0.475 and weighted average of $75,123, a difference of 11.1%.
French vs Immigrants from Guatemala Median Household Income

Median Household Income Correlation Summary

MeasurementFrenchImmigrants from Guatemala
Minimum$29,263$23,564
Maximum$135,625$94,609
Range$106,362$71,045
Mean$70,877$62,757
Median$72,372$64,030
Interquartile 25% (IQ1)$59,090$53,313
Interquartile 75% (IQ3)$79,064$74,300
Interquartile Range (IQR)$19,974$20,987
Standard Deviation (Sample)$17,004$14,592
Standard Deviation (Population)$16,918$14,488

Similar Demographics by Median Household Income

Demographics Similar to French by Median Household Income

In terms of median household income, the demographic groups most similar to French are Aleut ($83,446, a difference of 0.030%), Japanese ($83,395, a difference of 0.090%), Immigrants from Armenia ($83,555, a difference of 0.10%), German ($83,358, a difference of 0.13%), and Ghanaian ($83,582, a difference of 0.14%).
DemographicsRating | RankMedian Household Income
Immigrants | Colombia
31.7
/100
|
#189
Fair
$83,902
Slovaks
30.2
/100
|
#190
Fair
$83,798
Iraqis
29.6
/100
|
#191
Fair
$83,753
Welsh
28.0
/100
|
#192
Fair
$83,628
Finns
27.7
/100
|
#193
Fair
$83,607
Ghanaians
27.4
/100
|
#194
Fair
$83,582
Immigrants | Armenia
27.0
/100
|
#195
Fair
$83,555
French
26.0
/100
|
#196
Fair
$83,468
Aleuts
25.7
/100
|
#197
Fair
$83,446
Japanese
25.1
/100
|
#198
Fair
$83,395
Germans
24.6
/100
|
#199
Fair
$83,358
Tsimshian
24.5
/100
|
#200
Fair
$83,346
Spanish
24.4
/100
|
#201
Fair
$83,343
Immigrants | Thailand
24.3
/100
|
#202
Fair
$83,327
Immigrants | Cambodia
24.0
/100
|
#203
Fair
$83,304

Demographics Similar to Immigrants from Guatemala by Median Household Income

In terms of median household income, the demographic groups most similar to Immigrants from Guatemala are Osage ($75,240, a difference of 0.16%), Senegalese ($74,999, a difference of 0.16%), Immigrants from Liberia ($74,896, a difference of 0.30%), Spanish American ($75,386, a difference of 0.35%), and Central American Indian ($74,847, a difference of 0.37%).
DemographicsRating | RankMedian Household Income
Somalis
0.3
/100
|
#272
Tragic
$75,782
Liberians
0.2
/100
|
#273
Tragic
$75,667
British West Indians
0.2
/100
|
#274
Tragic
$75,647
Immigrants | Micronesia
0.2
/100
|
#275
Tragic
$75,574
Immigrants | Latin America
0.2
/100
|
#276
Tragic
$75,420
Spanish Americans
0.2
/100
|
#277
Tragic
$75,386
Osage
0.2
/100
|
#278
Tragic
$75,240
Immigrants | Guatemala
0.2
/100
|
#279
Tragic
$75,123
Senegalese
0.2
/100
|
#280
Tragic
$74,999
Immigrants | Liberia
0.1
/100
|
#281
Tragic
$74,896
Central American Indians
0.1
/100
|
#282
Tragic
$74,847
Cree
0.1
/100
|
#283
Tragic
$74,685
Yaqui
0.1
/100
|
#284
Tragic
$74,596
Mexicans
0.1
/100
|
#285
Tragic
$74,399
Immigrants | Somalia
0.1
/100
|
#286
Tragic
$74,300