Dutch vs Immigrants from Guatemala Median Household Income
COMPARE
Dutch
Immigrants from Guatemala
Median Household Income
Median Household Income Comparison
Dutch
Immigrants from Guatemala
$82,971
MEDIAN HOUSEHOLD INCOME
20.3/ 100
METRIC RATING
207th/ 347
METRIC RANK
$75,123
MEDIAN HOUSEHOLD INCOME
0.2/ 100
METRIC RATING
279th/ 347
METRIC RANK
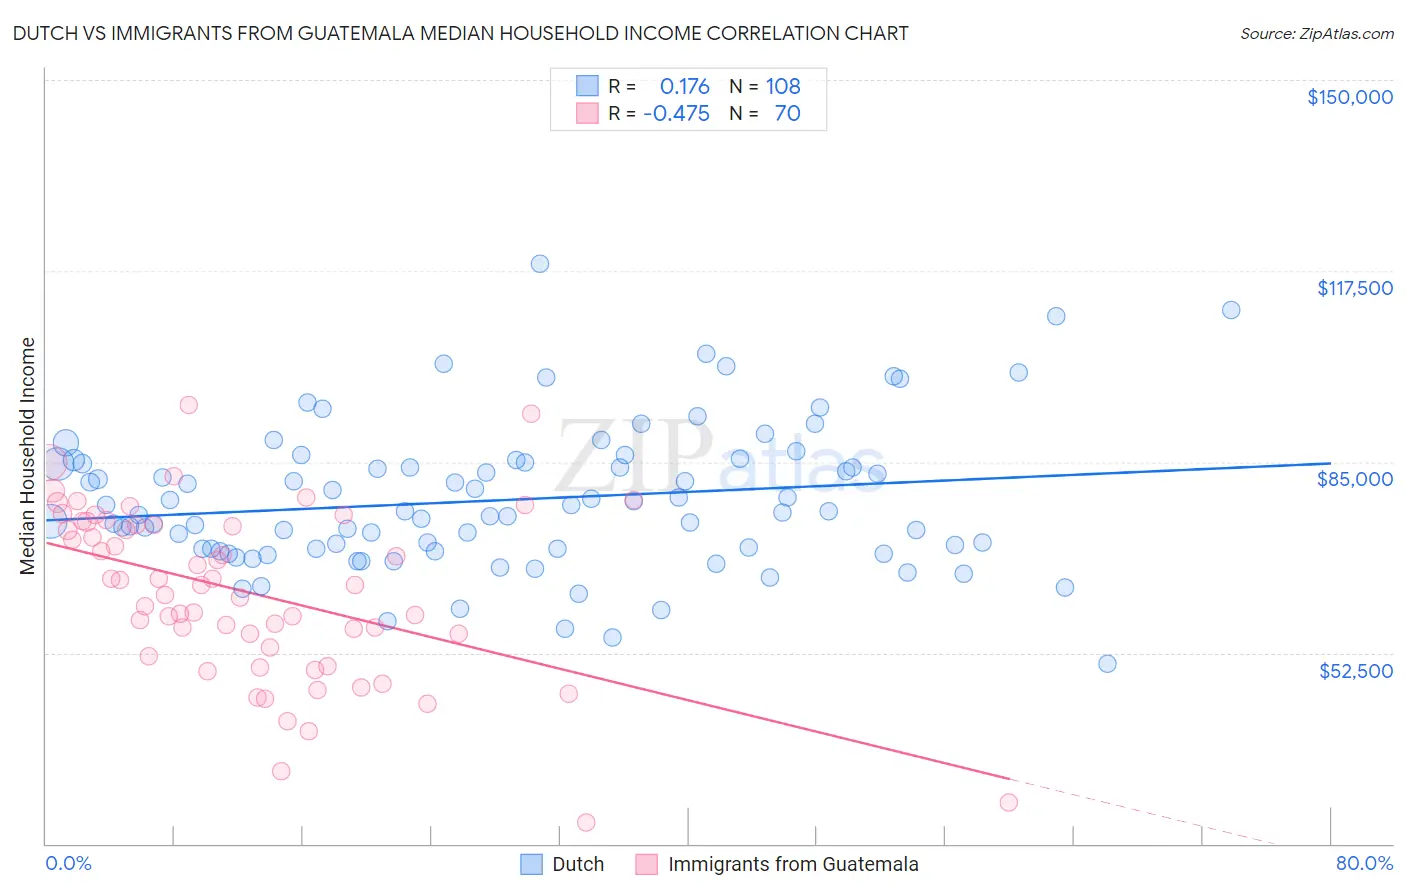
Dutch vs Immigrants from Guatemala Median Household Income Correlation Chart
The statistical analysis conducted on geographies consisting of 553,516,868 people shows a poor positive correlation between the proportion of Dutch and median household income in the United States with a correlation coefficient (R) of 0.176 and weighted average of $82,971. Similarly, the statistical analysis conducted on geographies consisting of 377,100,109 people shows a moderate negative correlation between the proportion of Immigrants from Guatemala and median household income in the United States with a correlation coefficient (R) of -0.475 and weighted average of $75,123, a difference of 10.4%.
Median Household Income Correlation Summary
| Measurement | Dutch | Immigrants from Guatemala |
| Minimum | $50,679 | $23,564 |
| Maximum | $118,750 | $94,609 |
| Range | $68,071 | $71,045 |
| Mean | $78,501 | $62,757 |
| Median | $76,487 | $64,030 |
| Interquartile 25% (IQ1) | $70,197 | $53,313 |
| Interquartile 75% (IQ3) | $84,813 | $74,300 |
| Interquartile Range (IQR) | $14,616 | $20,987 |
| Standard Deviation (Sample) | $12,272 | $14,592 |
| Standard Deviation (Population) | $12,215 | $14,488 |
Similar Demographics by Median Household Income
Demographics Similar to Dutch by Median Household Income
In terms of median household income, the demographic groups most similar to Dutch are Immigrants from Kenya ($83,068, a difference of 0.12%), French Canadian ($82,810, a difference of 0.19%), Celtic ($83,193, a difference of 0.27%), Immigrants from Africa ($83,289, a difference of 0.38%), and Immigrants from Cambodia ($83,304, a difference of 0.40%).
| Demographics | Rating | Rank | Median Household Income |
| Tsimshian | 24.5 /100 | #200 | Fair $83,346 |
| Spanish | 24.4 /100 | #201 | Fair $83,343 |
| Immigrants | Thailand | 24.3 /100 | #202 | Fair $83,327 |
| Immigrants | Cambodia | 24.0 /100 | #203 | Fair $83,304 |
| Immigrants | Africa | 23.8 /100 | #204 | Fair $83,289 |
| Celtics | 22.7 /100 | #205 | Fair $83,193 |
| Immigrants | Kenya | 21.3 /100 | #206 | Fair $83,068 |
| Dutch | 20.3 /100 | #207 | Fair $82,971 |
| French Canadians | 18.7 /100 | #208 | Poor $82,810 |
| Immigrants | Iraq | 16.7 /100 | #209 | Poor $82,594 |
| Immigrants | Uruguay | 16.4 /100 | #210 | Poor $82,560 |
| Salvadorans | 15.4 /100 | #211 | Poor $82,449 |
| Venezuelans | 15.3 /100 | #212 | Poor $82,432 |
| Nepalese | 15.1 /100 | #213 | Poor $82,410 |
| Panamanians | 14.0 /100 | #214 | Poor $82,272 |
Demographics Similar to Immigrants from Guatemala by Median Household Income
In terms of median household income, the demographic groups most similar to Immigrants from Guatemala are Osage ($75,240, a difference of 0.16%), Senegalese ($74,999, a difference of 0.16%), Immigrants from Liberia ($74,896, a difference of 0.30%), Spanish American ($75,386, a difference of 0.35%), and Central American Indian ($74,847, a difference of 0.37%).
| Demographics | Rating | Rank | Median Household Income |
| Somalis | 0.3 /100 | #272 | Tragic $75,782 |
| Liberians | 0.2 /100 | #273 | Tragic $75,667 |
| British West Indians | 0.2 /100 | #274 | Tragic $75,647 |
| Immigrants | Micronesia | 0.2 /100 | #275 | Tragic $75,574 |
| Immigrants | Latin America | 0.2 /100 | #276 | Tragic $75,420 |
| Spanish Americans | 0.2 /100 | #277 | Tragic $75,386 |
| Osage | 0.2 /100 | #278 | Tragic $75,240 |
| Immigrants | Guatemala | 0.2 /100 | #279 | Tragic $75,123 |
| Senegalese | 0.2 /100 | #280 | Tragic $74,999 |
| Immigrants | Liberia | 0.1 /100 | #281 | Tragic $74,896 |
| Central American Indians | 0.1 /100 | #282 | Tragic $74,847 |
| Cree | 0.1 /100 | #283 | Tragic $74,685 |
| Yaqui | 0.1 /100 | #284 | Tragic $74,596 |
| Mexicans | 0.1 /100 | #285 | Tragic $74,399 |
| Immigrants | Somalia | 0.1 /100 | #286 | Tragic $74,300 |