French American Indian vs Tsimshian Median Male Earnings
COMPARE
French American Indian
Tsimshian
Median Male Earnings
Median Male Earnings Comparison
French American Indians
Tsimshian
$50,611
MEDIAN MALE EARNINGS
2.2/ 100
METRIC RATING
243rd/ 347
METRIC RANK
$48,836
MEDIAN MALE EARNINGS
0.4/ 100
METRIC RATING
269th/ 347
METRIC RANK
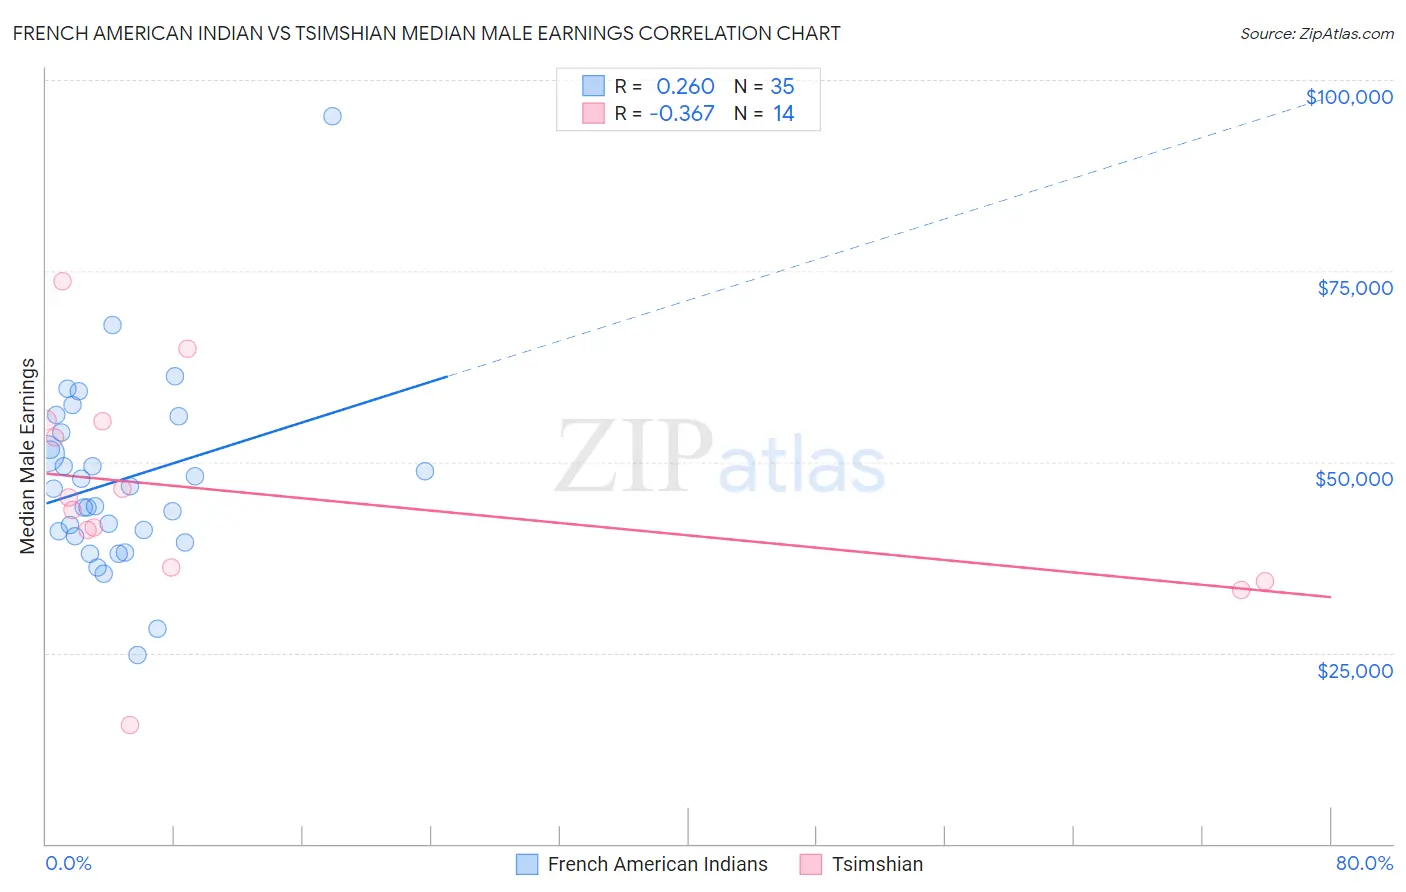
French American Indian vs Tsimshian Median Male Earnings Correlation Chart
The statistical analysis conducted on geographies consisting of 131,955,005 people shows a weak positive correlation between the proportion of French American Indians and median male earnings in the United States with a correlation coefficient (R) of 0.260 and weighted average of $50,611. Similarly, the statistical analysis conducted on geographies consisting of 15,625,423 people shows a mild negative correlation between the proportion of Tsimshian and median male earnings in the United States with a correlation coefficient (R) of -0.367 and weighted average of $48,836, a difference of 3.6%.
Median Male Earnings Correlation Summary
| Measurement | French American Indian | Tsimshian |
| Minimum | $24,718 | $15,625 |
| Maximum | $95,250 | $73,588 |
| Range | $70,532 | $57,963 |
| Mean | $47,583 | $45,710 |
| Median | $46,502 | $44,489 |
| Interquartile 25% (IQ1) | $40,215 | $36,250 |
| Interquartile 75% (IQ3) | $53,921 | $55,386 |
| Interquartile Range (IQR) | $13,706 | $19,136 |
| Standard Deviation (Sample) | $12,435 | $14,437 |
| Standard Deviation (Population) | $12,256 | $13,911 |
Similar Demographics by Median Male Earnings
Demographics Similar to French American Indians by Median Male Earnings
In terms of median male earnings, the demographic groups most similar to French American Indians are Guyanese ($50,613, a difference of 0.0%), Immigrants from St. Vincent and the Grenadines ($50,665, a difference of 0.11%), Houma ($50,547, a difference of 0.13%), West Indian ($50,682, a difference of 0.14%), and Hawaiian ($50,488, a difference of 0.24%).
| Demographics | Rating | Rank | Median Male Earnings |
| Pennsylvania Germans | 2.8 /100 | #236 | Tragic $50,878 |
| Immigrants | Barbados | 2.6 /100 | #237 | Tragic $50,795 |
| Malaysians | 2.5 /100 | #238 | Tragic $50,772 |
| Americans | 2.5 /100 | #239 | Tragic $50,761 |
| West Indians | 2.3 /100 | #240 | Tragic $50,682 |
| Immigrants | St. Vincent and the Grenadines | 2.3 /100 | #241 | Tragic $50,665 |
| Guyanese | 2.2 /100 | #242 | Tragic $50,613 |
| French American Indians | 2.2 /100 | #243 | Tragic $50,611 |
| Houma | 2.0 /100 | #244 | Tragic $50,547 |
| Hawaiians | 1.9 /100 | #245 | Tragic $50,488 |
| Immigrants | Ecuador | 1.9 /100 | #246 | Tragic $50,474 |
| Sub-Saharan Africans | 1.8 /100 | #247 | Tragic $50,408 |
| Immigrants | Guyana | 1.6 /100 | #248 | Tragic $50,321 |
| Immigrants | Burma/Myanmar | 1.6 /100 | #249 | Tragic $50,298 |
| Osage | 1.6 /100 | #250 | Tragic $50,292 |
Demographics Similar to Tsimshian by Median Male Earnings
In terms of median male earnings, the demographic groups most similar to Tsimshian are Ute ($48,899, a difference of 0.13%), Potawatomi ($48,768, a difference of 0.14%), Cherokee ($48,669, a difference of 0.34%), Spanish American ($49,008, a difference of 0.35%), and Somali ($49,025, a difference of 0.39%).
| Demographics | Rating | Rank | Median Male Earnings |
| Immigrants | West Indies | 0.6 /100 | #262 | Tragic $49,271 |
| Nicaraguans | 0.6 /100 | #263 | Tragic $49,215 |
| Immigrants | Middle Africa | 0.6 /100 | #264 | Tragic $49,201 |
| Immigrants | Laos | 0.6 /100 | #265 | Tragic $49,190 |
| Somalis | 0.5 /100 | #266 | Tragic $49,025 |
| Spanish Americans | 0.5 /100 | #267 | Tragic $49,008 |
| Ute | 0.4 /100 | #268 | Tragic $48,899 |
| Tsimshian | 0.4 /100 | #269 | Tragic $48,836 |
| Potawatomi | 0.4 /100 | #270 | Tragic $48,768 |
| Cherokee | 0.3 /100 | #271 | Tragic $48,669 |
| Salvadorans | 0.3 /100 | #272 | Tragic $48,646 |
| Jamaicans | 0.3 /100 | #273 | Tragic $48,632 |
| Colville | 0.3 /100 | #274 | Tragic $48,516 |
| Immigrants | Somalia | 0.3 /100 | #275 | Tragic $48,439 |
| Blackfeet | 0.3 /100 | #276 | Tragic $48,402 |