French American Indian vs Immigrants from India Median Male Earnings
COMPARE
French American Indian
Immigrants from India
Median Male Earnings
Median Male Earnings Comparison
French American Indians
Immigrants from India
$50,611
MEDIAN MALE EARNINGS
2.2/ 100
METRIC RATING
243rd/ 347
METRIC RANK
$74,207
MEDIAN MALE EARNINGS
100.0/ 100
METRIC RATING
2nd/ 347
METRIC RANK
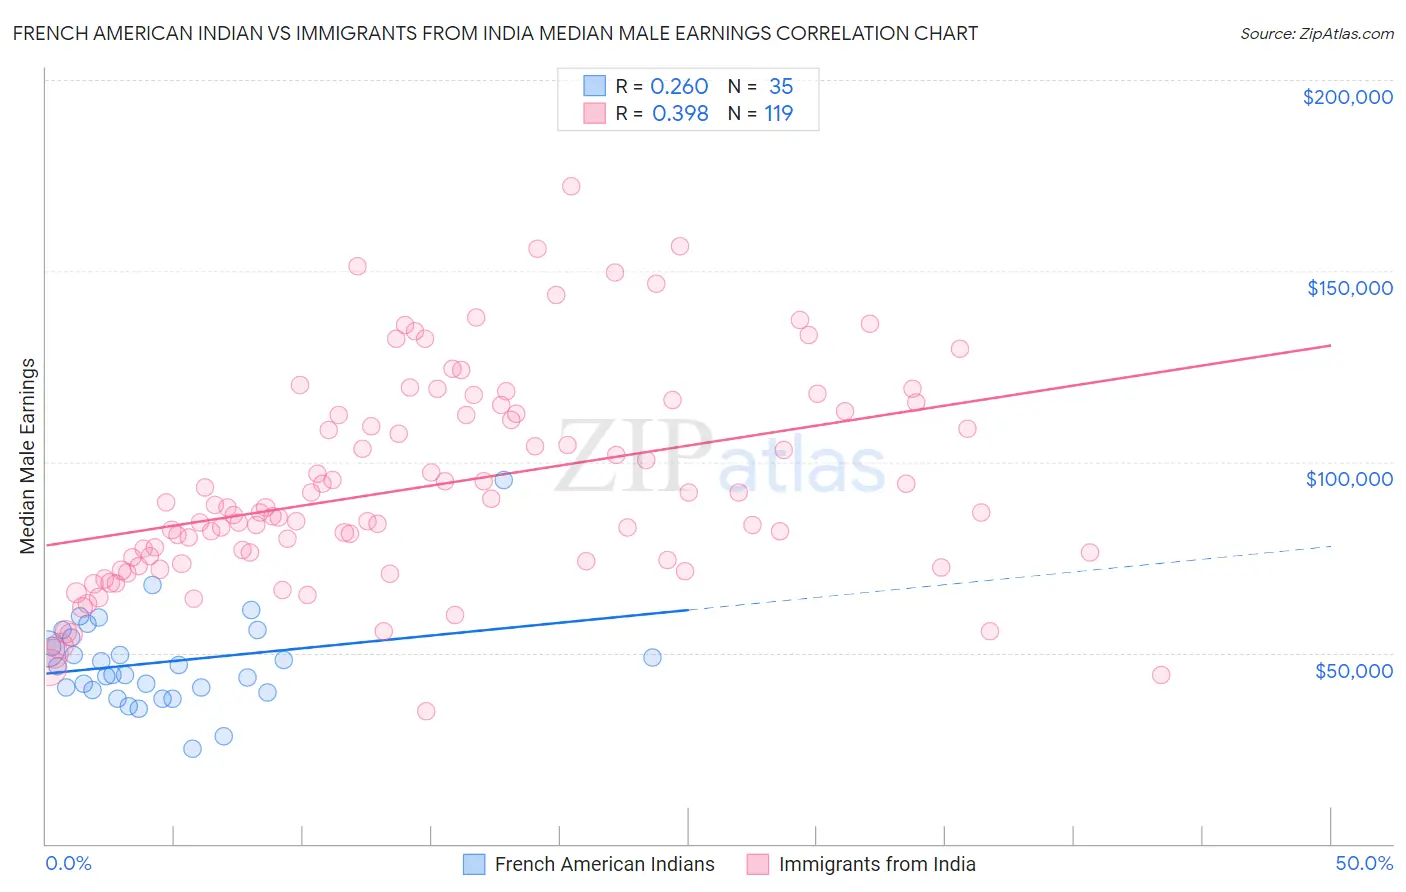
French American Indian vs Immigrants from India Median Male Earnings Correlation Chart
The statistical analysis conducted on geographies consisting of 131,955,005 people shows a weak positive correlation between the proportion of French American Indians and median male earnings in the United States with a correlation coefficient (R) of 0.260 and weighted average of $50,611. Similarly, the statistical analysis conducted on geographies consisting of 434,025,837 people shows a mild positive correlation between the proportion of Immigrants from India and median male earnings in the United States with a correlation coefficient (R) of 0.398 and weighted average of $74,207, a difference of 46.6%.
Median Male Earnings Correlation Summary
| Measurement | French American Indian | Immigrants from India |
| Minimum | $24,718 | $34,783 |
| Maximum | $95,250 | $172,259 |
| Range | $70,532 | $137,476 |
| Mean | $47,583 | $93,517 |
| Median | $46,502 | $86,905 |
| Interquartile 25% (IQ1) | $40,215 | $74,008 |
| Interquartile 75% (IQ3) | $53,921 | $112,721 |
| Interquartile Range (IQR) | $13,706 | $38,713 |
| Standard Deviation (Sample) | $12,435 | $27,317 |
| Standard Deviation (Population) | $12,256 | $27,202 |
Similar Demographics by Median Male Earnings
Demographics Similar to French American Indians by Median Male Earnings
In terms of median male earnings, the demographic groups most similar to French American Indians are Guyanese ($50,613, a difference of 0.0%), Immigrants from St. Vincent and the Grenadines ($50,665, a difference of 0.11%), Houma ($50,547, a difference of 0.13%), West Indian ($50,682, a difference of 0.14%), and Hawaiian ($50,488, a difference of 0.24%).
| Demographics | Rating | Rank | Median Male Earnings |
| Pennsylvania Germans | 2.8 /100 | #236 | Tragic $50,878 |
| Immigrants | Barbados | 2.6 /100 | #237 | Tragic $50,795 |
| Malaysians | 2.5 /100 | #238 | Tragic $50,772 |
| Americans | 2.5 /100 | #239 | Tragic $50,761 |
| West Indians | 2.3 /100 | #240 | Tragic $50,682 |
| Immigrants | St. Vincent and the Grenadines | 2.3 /100 | #241 | Tragic $50,665 |
| Guyanese | 2.2 /100 | #242 | Tragic $50,613 |
| French American Indians | 2.2 /100 | #243 | Tragic $50,611 |
| Houma | 2.0 /100 | #244 | Tragic $50,547 |
| Hawaiians | 1.9 /100 | #245 | Tragic $50,488 |
| Immigrants | Ecuador | 1.9 /100 | #246 | Tragic $50,474 |
| Sub-Saharan Africans | 1.8 /100 | #247 | Tragic $50,408 |
| Immigrants | Guyana | 1.6 /100 | #248 | Tragic $50,321 |
| Immigrants | Burma/Myanmar | 1.6 /100 | #249 | Tragic $50,298 |
| Osage | 1.6 /100 | #250 | Tragic $50,292 |
Demographics Similar to Immigrants from India by Median Male Earnings
In terms of median male earnings, the demographic groups most similar to Immigrants from India are Filipino ($74,224, a difference of 0.020%), Immigrants from Taiwan ($74,031, a difference of 0.24%), Thai ($72,135, a difference of 2.9%), Immigrants from Singapore ($71,348, a difference of 4.0%), and Iranian ($70,648, a difference of 5.0%).
| Demographics | Rating | Rank | Median Male Earnings |
| Filipinos | 100.0 /100 | #1 | Exceptional $74,224 |
| Immigrants | India | 100.0 /100 | #2 | Exceptional $74,207 |
| Immigrants | Taiwan | 100.0 /100 | #3 | Exceptional $74,031 |
| Thais | 100.0 /100 | #4 | Exceptional $72,135 |
| Immigrants | Singapore | 100.0 /100 | #5 | Exceptional $71,348 |
| Iranians | 100.0 /100 | #6 | Exceptional $70,648 |
| Immigrants | Hong Kong | 100.0 /100 | #7 | Exceptional $70,146 |
| Immigrants | Iran | 100.0 /100 | #8 | Exceptional $69,284 |
| Immigrants | South Central Asia | 100.0 /100 | #9 | Exceptional $68,960 |
| Immigrants | Israel | 100.0 /100 | #10 | Exceptional $68,716 |
| Immigrants | Ireland | 100.0 /100 | #11 | Exceptional $67,698 |
| Immigrants | Australia | 100.0 /100 | #12 | Exceptional $67,634 |
| Immigrants | China | 100.0 /100 | #13 | Exceptional $67,353 |
| Okinawans | 100.0 /100 | #14 | Exceptional $67,232 |
| Immigrants | Eastern Asia | 100.0 /100 | #15 | Exceptional $66,903 |