Immigrants from Pakistan vs Tsimshian Median Male Earnings
COMPARE
Immigrants from Pakistan
Tsimshian
Median Male Earnings
Median Male Earnings Comparison
Immigrants from Pakistan
Tsimshian
$60,987
MEDIAN MALE EARNINGS
99.8/ 100
METRIC RATING
63rd/ 347
METRIC RANK
$48,836
MEDIAN MALE EARNINGS
0.4/ 100
METRIC RATING
269th/ 347
METRIC RANK
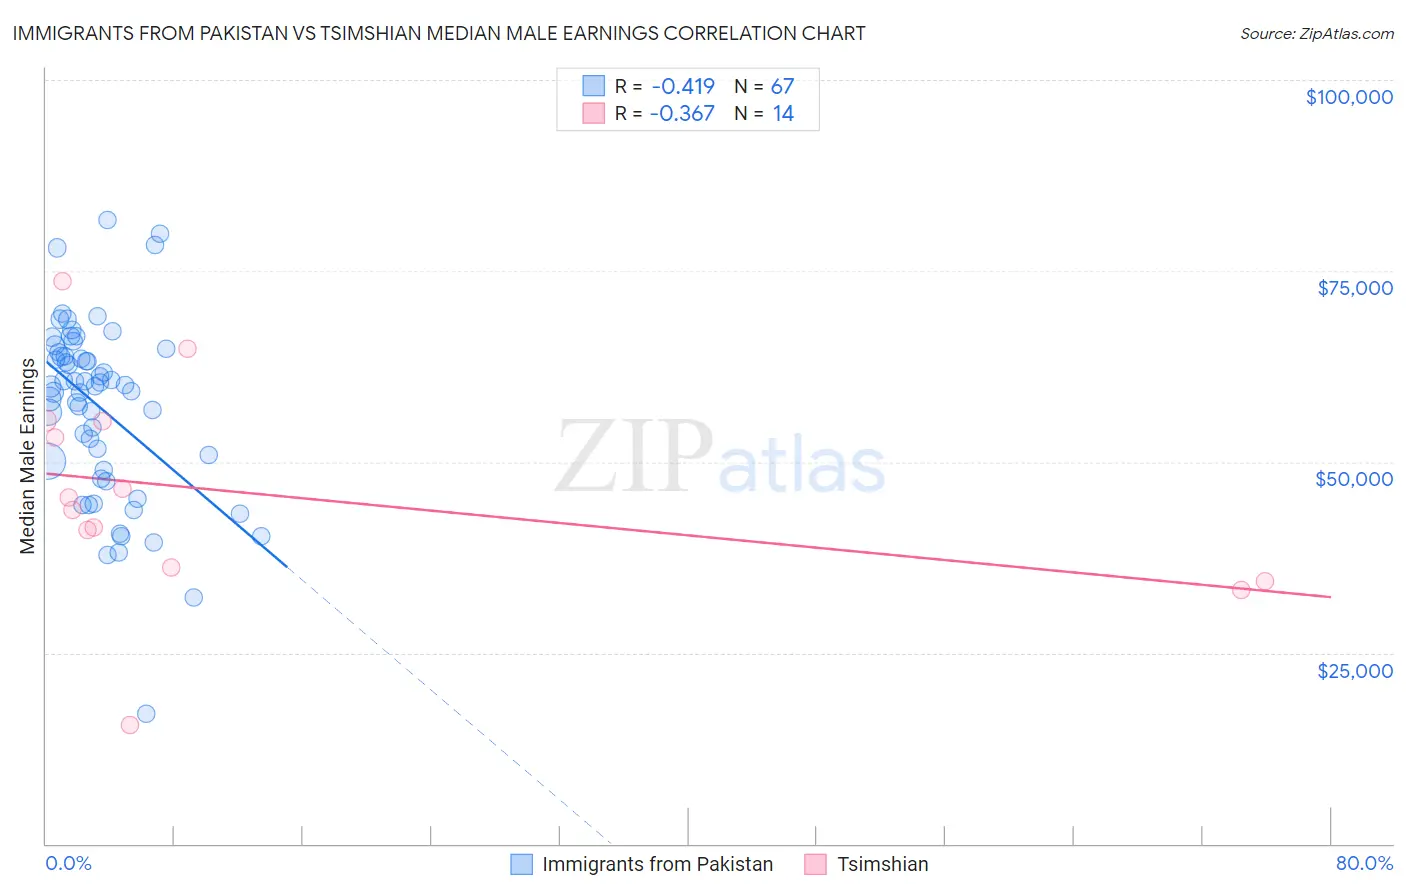
Immigrants from Pakistan vs Tsimshian Median Male Earnings Correlation Chart
The statistical analysis conducted on geographies consisting of 283,803,511 people shows a moderate negative correlation between the proportion of Immigrants from Pakistan and median male earnings in the United States with a correlation coefficient (R) of -0.419 and weighted average of $60,987. Similarly, the statistical analysis conducted on geographies consisting of 15,625,423 people shows a mild negative correlation between the proportion of Tsimshian and median male earnings in the United States with a correlation coefficient (R) of -0.367 and weighted average of $48,836, a difference of 24.9%.
Median Male Earnings Correlation Summary
| Measurement | Immigrants from Pakistan | Tsimshian |
| Minimum | $17,022 | $15,625 |
| Maximum | $81,734 | $73,588 |
| Range | $64,712 | $57,963 |
| Mean | $57,165 | $45,710 |
| Median | $59,890 | $44,489 |
| Interquartile 25% (IQ1) | $48,868 | $36,250 |
| Interquartile 75% (IQ3) | $64,399 | $55,386 |
| Interquartile Range (IQR) | $15,530 | $19,136 |
| Standard Deviation (Sample) | $11,844 | $14,437 |
| Standard Deviation (Population) | $11,755 | $13,911 |
Similar Demographics by Median Male Earnings
Demographics Similar to Immigrants from Pakistan by Median Male Earnings
In terms of median male earnings, the demographic groups most similar to Immigrants from Pakistan are Immigrants from Eastern Europe ($60,958, a difference of 0.050%), Immigrants from Indonesia ($60,935, a difference of 0.080%), Immigrants from Romania ($61,040, a difference of 0.090%), Immigrants from Croatia ($60,914, a difference of 0.12%), and Bolivian ($61,066, a difference of 0.13%).
| Demographics | Rating | Rank | Median Male Earnings |
| Lithuanians | 99.9 /100 | #56 | Exceptional $61,228 |
| Immigrants | Scotland | 99.9 /100 | #57 | Exceptional $61,220 |
| New Zealanders | 99.9 /100 | #58 | Exceptional $61,199 |
| Immigrants | Netherlands | 99.8 /100 | #59 | Exceptional $61,096 |
| Egyptians | 99.8 /100 | #60 | Exceptional $61,095 |
| Bolivians | 99.8 /100 | #61 | Exceptional $61,066 |
| Immigrants | Romania | 99.8 /100 | #62 | Exceptional $61,040 |
| Immigrants | Pakistan | 99.8 /100 | #63 | Exceptional $60,987 |
| Immigrants | Eastern Europe | 99.8 /100 | #64 | Exceptional $60,958 |
| Immigrants | Indonesia | 99.8 /100 | #65 | Exceptional $60,935 |
| Immigrants | Croatia | 99.8 /100 | #66 | Exceptional $60,914 |
| Immigrants | Spain | 99.8 /100 | #67 | Exceptional $60,750 |
| Immigrants | Serbia | 99.7 /100 | #68 | Exceptional $60,600 |
| Immigrants | Canada | 99.7 /100 | #69 | Exceptional $60,388 |
| Immigrants | Bulgaria | 99.7 /100 | #70 | Exceptional $60,358 |
Demographics Similar to Tsimshian by Median Male Earnings
In terms of median male earnings, the demographic groups most similar to Tsimshian are Ute ($48,899, a difference of 0.13%), Potawatomi ($48,768, a difference of 0.14%), Cherokee ($48,669, a difference of 0.34%), Spanish American ($49,008, a difference of 0.35%), and Somali ($49,025, a difference of 0.39%).
| Demographics | Rating | Rank | Median Male Earnings |
| Immigrants | West Indies | 0.6 /100 | #262 | Tragic $49,271 |
| Nicaraguans | 0.6 /100 | #263 | Tragic $49,215 |
| Immigrants | Middle Africa | 0.6 /100 | #264 | Tragic $49,201 |
| Immigrants | Laos | 0.6 /100 | #265 | Tragic $49,190 |
| Somalis | 0.5 /100 | #266 | Tragic $49,025 |
| Spanish Americans | 0.5 /100 | #267 | Tragic $49,008 |
| Ute | 0.4 /100 | #268 | Tragic $48,899 |
| Tsimshian | 0.4 /100 | #269 | Tragic $48,836 |
| Potawatomi | 0.4 /100 | #270 | Tragic $48,768 |
| Cherokee | 0.3 /100 | #271 | Tragic $48,669 |
| Salvadorans | 0.3 /100 | #272 | Tragic $48,646 |
| Jamaicans | 0.3 /100 | #273 | Tragic $48,632 |
| Colville | 0.3 /100 | #274 | Tragic $48,516 |
| Immigrants | Somalia | 0.3 /100 | #275 | Tragic $48,439 |
| Blackfeet | 0.3 /100 | #276 | Tragic $48,402 |