Ethiopian vs Belgian Median Family Income
COMPARE
Ethiopian
Belgian
Median Family Income
Median Family Income Comparison
Ethiopians
Belgians
$108,251
MEDIAN FAMILY INCOME
94.5/ 100
METRIC RATING
118th/ 347
METRIC RANK
$102,788
MEDIAN FAMILY INCOME
51.4/ 100
METRIC RATING
173rd/ 347
METRIC RANK
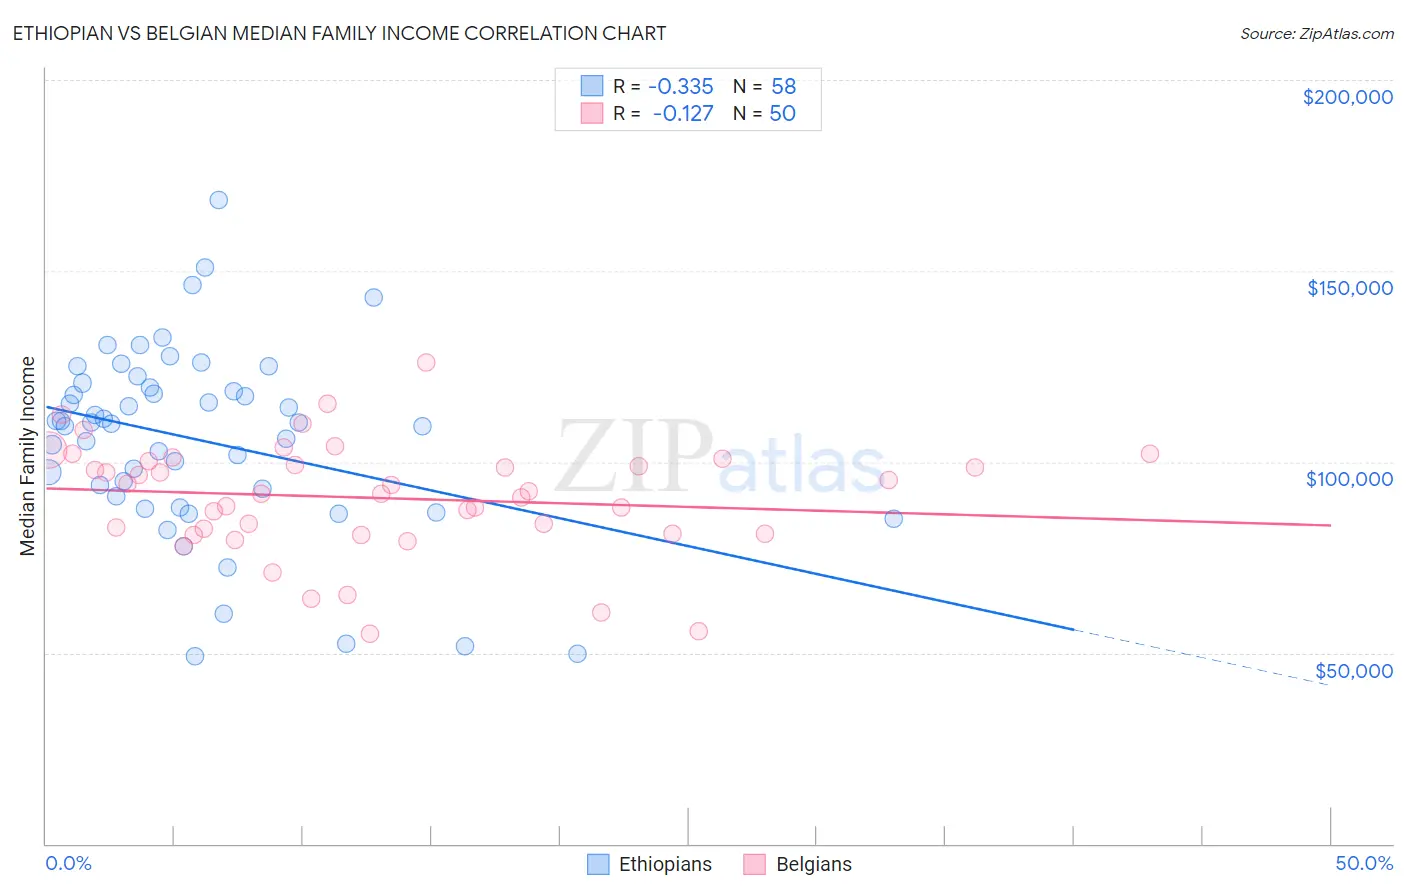
Ethiopian vs Belgian Median Family Income Correlation Chart
The statistical analysis conducted on geographies consisting of 223,032,575 people shows a mild negative correlation between the proportion of Ethiopians and median family income in the United States with a correlation coefficient (R) of -0.335 and weighted average of $108,251. Similarly, the statistical analysis conducted on geographies consisting of 355,758,296 people shows a poor negative correlation between the proportion of Belgians and median family income in the United States with a correlation coefficient (R) of -0.127 and weighted average of $102,788, a difference of 5.3%.
Median Family Income Correlation Summary
| Measurement | Ethiopian | Belgian |
| Minimum | $48,964 | $55,000 |
| Maximum | $168,594 | $126,094 |
| Range | $119,630 | $71,094 |
| Mean | $105,611 | $90,563 |
| Median | $110,185 | $92,069 |
| Interquartile 25% (IQ1) | $91,124 | $81,250 |
| Interquartile 75% (IQ3) | $119,625 | $100,134 |
| Interquartile Range (IQR) | $28,501 | $18,884 |
| Standard Deviation (Sample) | $24,590 | $14,839 |
| Standard Deviation (Population) | $24,377 | $14,690 |
Similar Demographics by Median Family Income
Demographics Similar to Ethiopians by Median Family Income
In terms of median family income, the demographic groups most similar to Ethiopians are Sri Lankan ($108,234, a difference of 0.020%), Immigrants from Philippines ($108,288, a difference of 0.030%), Immigrants from Northern Africa ($108,161, a difference of 0.080%), European ($108,099, a difference of 0.14%), and Chilean ($108,429, a difference of 0.16%).
| Demographics | Rating | Rank | Median Family Income |
| Immigrants | Western Asia | 95.6 /100 | #111 | Exceptional $108,691 |
| Immigrants | Poland | 95.3 /100 | #112 | Exceptional $108,570 |
| Immigrants | Saudi Arabia | 95.2 /100 | #113 | Exceptional $108,544 |
| Poles | 95.2 /100 | #114 | Exceptional $108,507 |
| Swedes | 95.1 /100 | #115 | Exceptional $108,499 |
| Chileans | 95.0 /100 | #116 | Exceptional $108,429 |
| Immigrants | Philippines | 94.6 /100 | #117 | Exceptional $108,288 |
| Ethiopians | 94.5 /100 | #118 | Exceptional $108,251 |
| Sri Lankans | 94.5 /100 | #119 | Exceptional $108,234 |
| Immigrants | Northern Africa | 94.3 /100 | #120 | Exceptional $108,161 |
| Europeans | 94.1 /100 | #121 | Exceptional $108,099 |
| Immigrants | Jordan | 92.9 /100 | #122 | Exceptional $107,715 |
| Carpatho Rusyns | 92.2 /100 | #123 | Exceptional $107,502 |
| Pakistanis | 91.7 /100 | #124 | Exceptional $107,390 |
| Taiwanese | 91.4 /100 | #125 | Exceptional $107,295 |
Demographics Similar to Belgians by Median Family Income
In terms of median family income, the demographic groups most similar to Belgians are Immigrants from Eritrea ($102,823, a difference of 0.030%), Finnish ($102,676, a difference of 0.11%), Alsatian ($103,010, a difference of 0.22%), Immigrants from Eastern Africa ($102,451, a difference of 0.33%), and Immigrants from Uzbekistan ($103,197, a difference of 0.40%).
| Demographics | Rating | Rank | Median Family Income |
| English | 62.6 /100 | #166 | Good $103,684 |
| South American Indians | 61.9 /100 | #167 | Good $103,624 |
| Immigrants | Peru | 60.8 /100 | #168 | Good $103,534 |
| Czechoslovakians | 57.6 /100 | #169 | Average $103,273 |
| Immigrants | Uzbekistan | 56.6 /100 | #170 | Average $103,197 |
| Alsatians | 54.3 /100 | #171 | Average $103,010 |
| Immigrants | Eritrea | 51.9 /100 | #172 | Average $102,823 |
| Belgians | 51.4 /100 | #173 | Average $102,788 |
| Finns | 50.0 /100 | #174 | Average $102,676 |
| Immigrants | Eastern Africa | 47.1 /100 | #175 | Average $102,451 |
| French | 46.1 /100 | #176 | Average $102,368 |
| Germans | 44.6 /100 | #177 | Average $102,254 |
| Welsh | 43.3 /100 | #178 | Average $102,151 |
| South Americans | 39.7 /100 | #179 | Fair $101,856 |
| French Canadians | 37.0 /100 | #180 | Fair $101,634 |