Ethiopian vs Immigrants from Cabo Verde Median Family Income
COMPARE
Ethiopian
Immigrants from Cabo Verde
Median Family Income
Median Family Income Comparison
Ethiopians
Immigrants from Cabo Verde
$108,251
MEDIAN FAMILY INCOME
94.5/ 100
METRIC RATING
118th/ 347
METRIC RANK
$87,830
MEDIAN FAMILY INCOME
0.1/ 100
METRIC RATING
291st/ 347
METRIC RANK
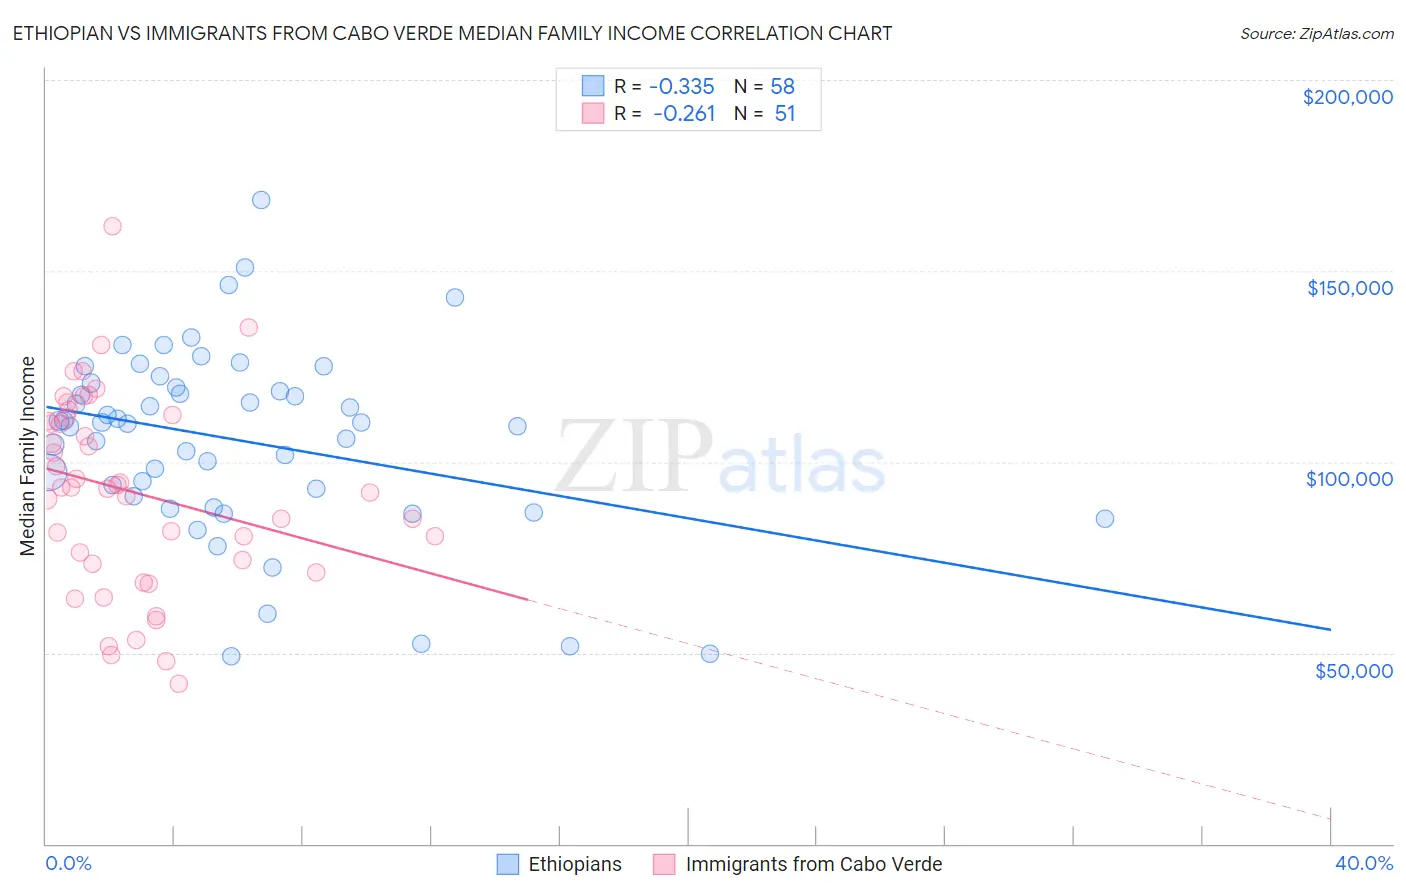
Ethiopian vs Immigrants from Cabo Verde Median Family Income Correlation Chart
The statistical analysis conducted on geographies consisting of 223,032,575 people shows a mild negative correlation between the proportion of Ethiopians and median family income in the United States with a correlation coefficient (R) of -0.335 and weighted average of $108,251. Similarly, the statistical analysis conducted on geographies consisting of 38,130,720 people shows a weak negative correlation between the proportion of Immigrants from Cabo Verde and median family income in the United States with a correlation coefficient (R) of -0.261 and weighted average of $87,830, a difference of 23.3%.
Median Family Income Correlation Summary
| Measurement | Ethiopian | Immigrants from Cabo Verde |
| Minimum | $48,964 | $41,875 |
| Maximum | $168,594 | $161,685 |
| Range | $119,630 | $119,810 |
| Mean | $105,611 | $92,155 |
| Median | $110,185 | $93,152 |
| Interquartile 25% (IQ1) | $91,124 | $73,200 |
| Interquartile 75% (IQ3) | $119,625 | $111,657 |
| Interquartile Range (IQR) | $28,501 | $38,457 |
| Standard Deviation (Sample) | $24,590 | $25,505 |
| Standard Deviation (Population) | $24,377 | $25,254 |
Similar Demographics by Median Family Income
Demographics Similar to Ethiopians by Median Family Income
In terms of median family income, the demographic groups most similar to Ethiopians are Sri Lankan ($108,234, a difference of 0.020%), Immigrants from Philippines ($108,288, a difference of 0.030%), Immigrants from Northern Africa ($108,161, a difference of 0.080%), European ($108,099, a difference of 0.14%), and Chilean ($108,429, a difference of 0.16%).
| Demographics | Rating | Rank | Median Family Income |
| Immigrants | Western Asia | 95.6 /100 | #111 | Exceptional $108,691 |
| Immigrants | Poland | 95.3 /100 | #112 | Exceptional $108,570 |
| Immigrants | Saudi Arabia | 95.2 /100 | #113 | Exceptional $108,544 |
| Poles | 95.2 /100 | #114 | Exceptional $108,507 |
| Swedes | 95.1 /100 | #115 | Exceptional $108,499 |
| Chileans | 95.0 /100 | #116 | Exceptional $108,429 |
| Immigrants | Philippines | 94.6 /100 | #117 | Exceptional $108,288 |
| Ethiopians | 94.5 /100 | #118 | Exceptional $108,251 |
| Sri Lankans | 94.5 /100 | #119 | Exceptional $108,234 |
| Immigrants | Northern Africa | 94.3 /100 | #120 | Exceptional $108,161 |
| Europeans | 94.1 /100 | #121 | Exceptional $108,099 |
| Immigrants | Jordan | 92.9 /100 | #122 | Exceptional $107,715 |
| Carpatho Rusyns | 92.2 /100 | #123 | Exceptional $107,502 |
| Pakistanis | 91.7 /100 | #124 | Exceptional $107,390 |
| Taiwanese | 91.4 /100 | #125 | Exceptional $107,295 |
Demographics Similar to Immigrants from Cabo Verde by Median Family Income
In terms of median family income, the demographic groups most similar to Immigrants from Cabo Verde are African ($87,820, a difference of 0.010%), Shoshone ($87,872, a difference of 0.050%), Central American Indian ($88,034, a difference of 0.23%), Ute ($87,596, a difference of 0.27%), and Cherokee ($88,209, a difference of 0.43%).
| Demographics | Rating | Rank | Median Family Income |
| Indonesians | 0.1 /100 | #284 | Tragic $88,301 |
| Guatemalans | 0.1 /100 | #285 | Tragic $88,295 |
| Immigrants | Nicaragua | 0.1 /100 | #286 | Tragic $88,267 |
| Potawatomi | 0.1 /100 | #287 | Tragic $88,265 |
| Cherokee | 0.1 /100 | #288 | Tragic $88,209 |
| Central American Indians | 0.1 /100 | #289 | Tragic $88,034 |
| Shoshone | 0.1 /100 | #290 | Tragic $87,872 |
| Immigrants | Cabo Verde | 0.1 /100 | #291 | Tragic $87,830 |
| Africans | 0.1 /100 | #292 | Tragic $87,820 |
| Ute | 0.0 /100 | #293 | Tragic $87,596 |
| Fijians | 0.0 /100 | #294 | Tragic $87,387 |
| Yaqui | 0.0 /100 | #295 | Tragic $87,289 |
| Immigrants | Guatemala | 0.0 /100 | #296 | Tragic $87,191 |
| Cajuns | 0.0 /100 | #297 | Tragic $87,157 |
| Immigrants | Latin America | 0.0 /100 | #298 | Tragic $86,989 |