Dutch West Indian vs Belgian Median Family Income
COMPARE
Dutch West Indian
Belgian
Median Family Income
Median Family Income Comparison
Dutch West Indians
Belgians
$81,852
MEDIAN FAMILY INCOME
0.0/ 100
METRIC RATING
329th/ 347
METRIC RANK
$102,788
MEDIAN FAMILY INCOME
51.4/ 100
METRIC RATING
173rd/ 347
METRIC RANK
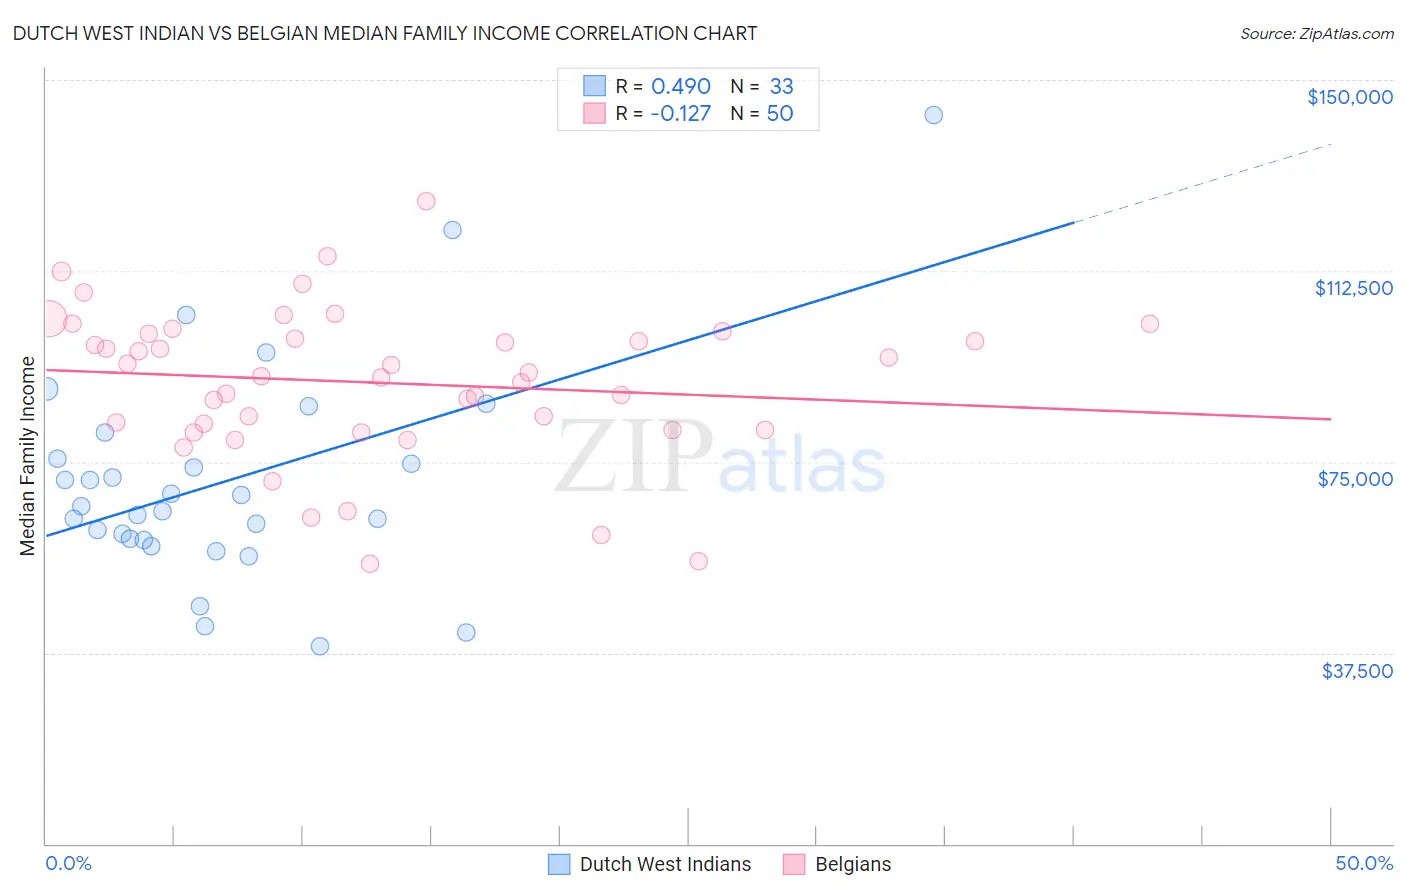
Dutch West Indian vs Belgian Median Family Income Correlation Chart
The statistical analysis conducted on geographies consisting of 85,761,161 people shows a moderate positive correlation between the proportion of Dutch West Indians and median family income in the United States with a correlation coefficient (R) of 0.490 and weighted average of $81,852. Similarly, the statistical analysis conducted on geographies consisting of 355,758,296 people shows a poor negative correlation between the proportion of Belgians and median family income in the United States with a correlation coefficient (R) of -0.127 and weighted average of $102,788, a difference of 25.6%.
Median Family Income Correlation Summary
| Measurement | Dutch West Indian | Belgian |
| Minimum | $38,750 | $55,000 |
| Maximum | $143,036 | $126,094 |
| Range | $104,286 | $71,094 |
| Mean | $71,323 | $90,563 |
| Median | $66,291 | $92,069 |
| Interquartile 25% (IQ1) | $59,737 | $81,250 |
| Interquartile 75% (IQ3) | $78,266 | $100,134 |
| Interquartile Range (IQR) | $18,529 | $18,884 |
| Standard Deviation (Sample) | $21,583 | $14,839 |
| Standard Deviation (Population) | $21,254 | $14,690 |
Similar Demographics by Median Family Income
Demographics Similar to Dutch West Indians by Median Family Income
In terms of median family income, the demographic groups most similar to Dutch West Indians are Black/African American ($81,912, a difference of 0.070%), Arapaho ($82,064, a difference of 0.26%), Immigrants from Congo ($82,216, a difference of 0.45%), Cheyenne ($81,385, a difference of 0.57%), and Sioux ($82,386, a difference of 0.65%).
| Demographics | Rating | Rank | Median Family Income |
| Dominicans | 0.0 /100 | #322 | Tragic $82,888 |
| Bahamians | 0.0 /100 | #323 | Tragic $82,631 |
| Creek | 0.0 /100 | #324 | Tragic $82,560 |
| Sioux | 0.0 /100 | #325 | Tragic $82,386 |
| Immigrants | Congo | 0.0 /100 | #326 | Tragic $82,216 |
| Arapaho | 0.0 /100 | #327 | Tragic $82,064 |
| Blacks/African Americans | 0.0 /100 | #328 | Tragic $81,912 |
| Dutch West Indians | 0.0 /100 | #329 | Tragic $81,852 |
| Cheyenne | 0.0 /100 | #330 | Tragic $81,385 |
| Immigrants | Dominican Republic | 0.0 /100 | #331 | Tragic $81,233 |
| Natives/Alaskans | 0.0 /100 | #332 | Tragic $80,908 |
| Kiowa | 0.0 /100 | #333 | Tragic $80,885 |
| Menominee | 0.0 /100 | #334 | Tragic $79,563 |
| Yup'ik | 0.0 /100 | #335 | Tragic $79,290 |
| Immigrants | Cuba | 0.0 /100 | #336 | Tragic $78,249 |
Demographics Similar to Belgians by Median Family Income
In terms of median family income, the demographic groups most similar to Belgians are Immigrants from Eritrea ($102,823, a difference of 0.030%), Finnish ($102,676, a difference of 0.11%), Alsatian ($103,010, a difference of 0.22%), Immigrants from Eastern Africa ($102,451, a difference of 0.33%), and Immigrants from Uzbekistan ($103,197, a difference of 0.40%).
| Demographics | Rating | Rank | Median Family Income |
| English | 62.6 /100 | #166 | Good $103,684 |
| South American Indians | 61.9 /100 | #167 | Good $103,624 |
| Immigrants | Peru | 60.8 /100 | #168 | Good $103,534 |
| Czechoslovakians | 57.6 /100 | #169 | Average $103,273 |
| Immigrants | Uzbekistan | 56.6 /100 | #170 | Average $103,197 |
| Alsatians | 54.3 /100 | #171 | Average $103,010 |
| Immigrants | Eritrea | 51.9 /100 | #172 | Average $102,823 |
| Belgians | 51.4 /100 | #173 | Average $102,788 |
| Finns | 50.0 /100 | #174 | Average $102,676 |
| Immigrants | Eastern Africa | 47.1 /100 | #175 | Average $102,451 |
| French | 46.1 /100 | #176 | Average $102,368 |
| Germans | 44.6 /100 | #177 | Average $102,254 |
| Welsh | 43.3 /100 | #178 | Average $102,151 |
| South Americans | 39.7 /100 | #179 | Fair $101,856 |
| French Canadians | 37.0 /100 | #180 | Fair $101,634 |