Eastern European vs Bolivian Median Family Income
COMPARE
Eastern European
Bolivian
Median Family Income
Median Family Income Comparison
Eastern Europeans
Bolivians
$125,546
MEDIAN FAMILY INCOME
100.0/ 100
METRIC RATING
15th/ 347
METRIC RANK
$119,479
MEDIAN FAMILY INCOME
100.0/ 100
METRIC RATING
34th/ 347
METRIC RANK
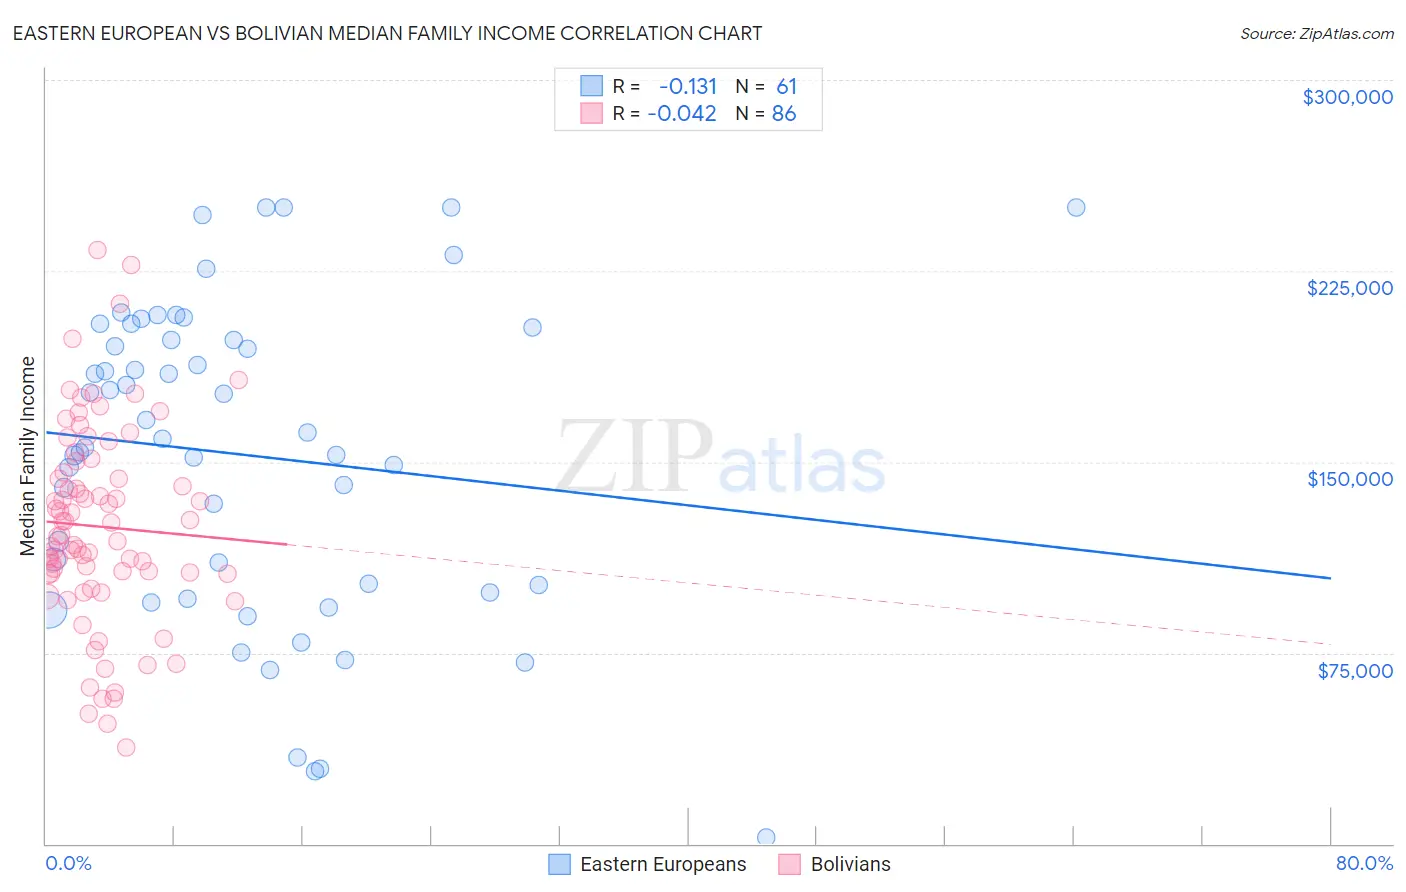
Eastern European vs Bolivian Median Family Income Correlation Chart
The statistical analysis conducted on geographies consisting of 460,782,256 people shows a poor negative correlation between the proportion of Eastern Europeans and median family income in the United States with a correlation coefficient (R) of -0.131 and weighted average of $125,546. Similarly, the statistical analysis conducted on geographies consisting of 184,605,478 people shows no correlation between the proportion of Bolivians and median family income in the United States with a correlation coefficient (R) of -0.042 and weighted average of $119,479, a difference of 5.1%.
Median Family Income Correlation Summary
| Measurement | Eastern European | Bolivian |
| Minimum | $2,499 | $37,679 |
| Maximum | $250,001 | $233,276 |
| Range | $247,502 | $195,597 |
| Mean | $152,671 | $124,569 |
| Median | $158,974 | $120,978 |
| Interquartile 25% (IQ1) | $100,360 | $106,050 |
| Interquartile 75% (IQ3) | $200,154 | $145,603 |
| Interquartile Range (IQR) | $99,794 | $39,553 |
| Standard Deviation (Sample) | $61,552 | $39,306 |
| Standard Deviation (Population) | $61,045 | $39,077 |
Demographics Similar to Eastern Europeans and Bolivians by Median Family Income
In terms of median family income, the demographic groups most similar to Eastern Europeans are Immigrants from China ($125,540, a difference of 0.0%), Indian (Asian) ($125,312, a difference of 0.19%), Immigrants from Eastern Asia ($125,150, a difference of 0.32%), Immigrants from South Central Asia ($125,956, a difference of 0.33%), and Immigrants from Belgium ($123,831, a difference of 1.4%). Similarly, the demographic groups most similar to Bolivians are Bhutanese ($119,800, a difference of 0.27%), Asian ($119,955, a difference of 0.40%), Immigrants from France ($120,076, a difference of 0.50%), Immigrants from Sri Lanka ($120,263, a difference of 0.66%), and Latvian ($120,301, a difference of 0.69%).
| Demographics | Rating | Rank | Median Family Income |
| Immigrants | South Central Asia | 100.0 /100 | #14 | Exceptional $125,956 |
| Eastern Europeans | 100.0 /100 | #15 | Exceptional $125,546 |
| Immigrants | China | 100.0 /100 | #16 | Exceptional $125,540 |
| Indians (Asian) | 100.0 /100 | #17 | Exceptional $125,312 |
| Immigrants | Eastern Asia | 100.0 /100 | #18 | Exceptional $125,150 |
| Immigrants | Belgium | 100.0 /100 | #19 | Exceptional $123,831 |
| Burmese | 100.0 /100 | #20 | Exceptional $123,369 |
| Immigrants | Korea | 100.0 /100 | #21 | Exceptional $122,800 |
| Immigrants | Sweden | 100.0 /100 | #22 | Exceptional $122,765 |
| Immigrants | Japan | 100.0 /100 | #23 | Exceptional $122,764 |
| Immigrants | Northern Europe | 100.0 /100 | #24 | Exceptional $121,840 |
| Turks | 100.0 /100 | #25 | Exceptional $121,202 |
| Immigrants | Switzerland | 100.0 /100 | #26 | Exceptional $120,726 |
| Russians | 100.0 /100 | #27 | Exceptional $120,487 |
| Immigrants | Denmark | 100.0 /100 | #28 | Exceptional $120,445 |
| Latvians | 100.0 /100 | #29 | Exceptional $120,301 |
| Immigrants | Sri Lanka | 100.0 /100 | #30 | Exceptional $120,263 |
| Immigrants | France | 100.0 /100 | #31 | Exceptional $120,076 |
| Asians | 100.0 /100 | #32 | Exceptional $119,955 |
| Bhutanese | 100.0 /100 | #33 | Exceptional $119,800 |
| Bolivians | 100.0 /100 | #34 | Exceptional $119,479 |