Cree vs Nonimmigrants Wage/Income Gap
COMPARE
Cree
Nonimmigrants
Wage/Income Gap
Wage/Income Gap Comparison
Cree
Nonimmigrants
24.5%
WAGE/INCOME GAP
95.6/ 100
METRIC RATING
120th/ 347
METRIC RANK
27.2%
WAGE/INCOME GAP
3.3/ 100
METRIC RATING
246th/ 347
METRIC RANK
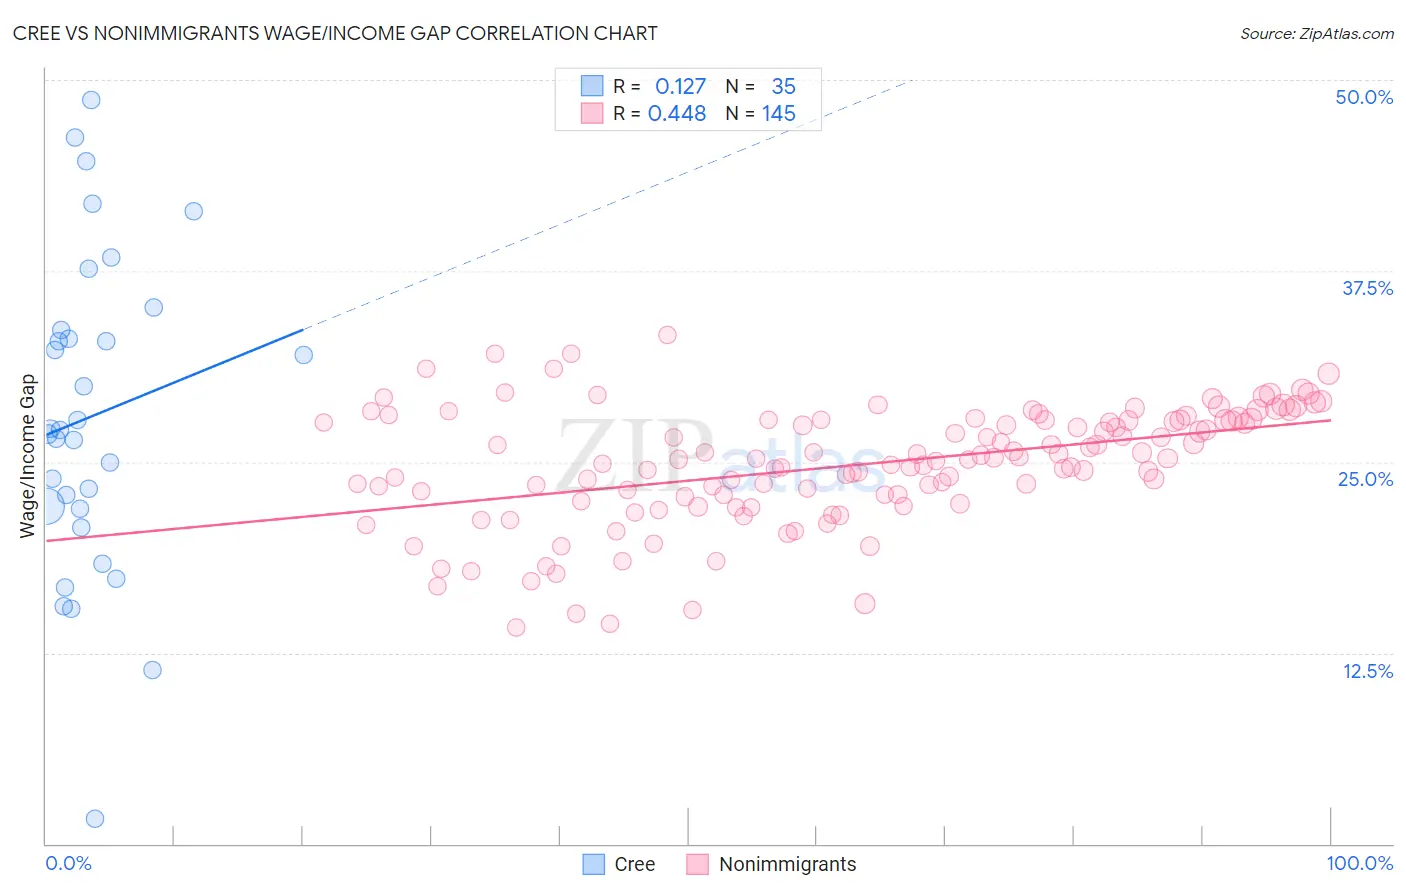
Cree vs Nonimmigrants Wage/Income Gap Correlation Chart
The statistical analysis conducted on geographies consisting of 76,178,665 people shows a poor positive correlation between the proportion of Cree and wage/income gap percentage in the United States with a correlation coefficient (R) of 0.127 and weighted average of 24.5%. Similarly, the statistical analysis conducted on geographies consisting of 579,671,089 people shows a moderate positive correlation between the proportion of Nonimmigrants and wage/income gap percentage in the United States with a correlation coefficient (R) of 0.448 and weighted average of 27.2%, a difference of 11.1%.
Wage/Income Gap Correlation Summary
| Measurement | Cree | Nonimmigrants |
| Minimum | 1.7% | 14.2% |
| Maximum | 48.7% | 33.3% |
| Range | 47.0% | 19.1% |
| Mean | 28.0% | 24.8% |
| Median | 27.1% | 25.2% |
| Interquartile 25% (IQ1) | 21.9% | 22.8% |
| Interquartile 75% (IQ3) | 33.6% | 27.7% |
| Interquartile Range (IQR) | 11.7% | 5.0% |
| Standard Deviation (Sample) | 10.3% | 3.8% |
| Standard Deviation (Population) | 10.2% | 3.8% |
Similar Demographics by Wage/Income Gap
Demographics Similar to Cree by Wage/Income Gap
In terms of wage/income gap, the demographic groups most similar to Cree are Kenyan (24.5%, a difference of 0.070%), Immigrants from Micronesia (24.4%, a difference of 0.090%), Immigrants from Afghanistan (24.4%, a difference of 0.13%), Alaska Native (24.4%, a difference of 0.19%), and Immigrants from Thailand (24.5%, a difference of 0.27%).
| Demographics | Rating | Rank | Wage/Income Gap |
| Sioux | 96.9 /100 | #113 | Exceptional 24.3% |
| Panamanians | 96.5 /100 | #114 | Exceptional 24.4% |
| Immigrants | Kenya | 96.4 /100 | #115 | Exceptional 24.4% |
| Alaska Natives | 96.0 /100 | #116 | Exceptional 24.4% |
| Immigrants | Afghanistan | 95.9 /100 | #117 | Exceptional 24.4% |
| Immigrants | Micronesia | 95.8 /100 | #118 | Exceptional 24.4% |
| Kenyans | 95.8 /100 | #119 | Exceptional 24.5% |
| Cree | 95.6 /100 | #120 | Exceptional 24.5% |
| Immigrants | Thailand | 94.9 /100 | #121 | Exceptional 24.5% |
| Apache | 94.8 /100 | #122 | Exceptional 24.5% |
| Natives/Alaskans | 94.6 /100 | #123 | Exceptional 24.6% |
| Immigrants | South America | 93.9 /100 | #124 | Exceptional 24.6% |
| Spanish Americans | 93.8 /100 | #125 | Exceptional 24.6% |
| Immigrants | Uruguay | 93.8 /100 | #126 | Exceptional 24.6% |
| German Russians | 93.7 /100 | #127 | Exceptional 24.6% |
Demographics Similar to Nonimmigrants by Wage/Income Gap
In terms of wage/income gap, the demographic groups most similar to Nonimmigrants are Immigrants from the Azores (27.2%, a difference of 0.080%), Chickasaw (27.2%, a difference of 0.090%), Spanish (27.1%, a difference of 0.16%), Immigrants from Sri Lanka (27.1%, a difference of 0.17%), and Creek (27.1%, a difference of 0.22%).
| Demographics | Rating | Rank | Wage/Income Gap |
| Estonians | 4.3 /100 | #239 | Tragic 27.1% |
| Immigrants | Europe | 3.8 /100 | #240 | Tragic 27.1% |
| Creek | 3.8 /100 | #241 | Tragic 27.1% |
| Immigrants | Sri Lanka | 3.7 /100 | #242 | Tragic 27.1% |
| Spanish | 3.6 /100 | #243 | Tragic 27.1% |
| Chickasaw | 3.5 /100 | #244 | Tragic 27.2% |
| Immigrants | Azores | 3.5 /100 | #245 | Tragic 27.2% |
| Immigrants | Nonimmigrants | 3.3 /100 | #246 | Tragic 27.2% |
| Celtics | 2.8 /100 | #247 | Tragic 27.3% |
| Cypriots | 2.8 /100 | #248 | Tragic 27.3% |
| Carpatho Rusyns | 2.7 /100 | #249 | Tragic 27.3% |
| Immigrants | Czechoslovakia | 2.7 /100 | #250 | Tragic 27.3% |
| Immigrants | Norway | 2.5 /100 | #251 | Tragic 27.3% |
| Ukrainians | 2.4 /100 | #252 | Tragic 27.3% |
| Portuguese | 2.2 /100 | #253 | Tragic 27.4% |