Comanche vs British Median Male Earnings
COMPARE
Comanche
British
Median Male Earnings
Median Male Earnings Comparison
Comanche
British
$48,202
MEDIAN MALE EARNINGS
0.2/ 100
METRIC RATING
280th/ 347
METRIC RANK
$57,890
MEDIAN MALE EARNINGS
96.5/ 100
METRIC RATING
109th/ 347
METRIC RANK
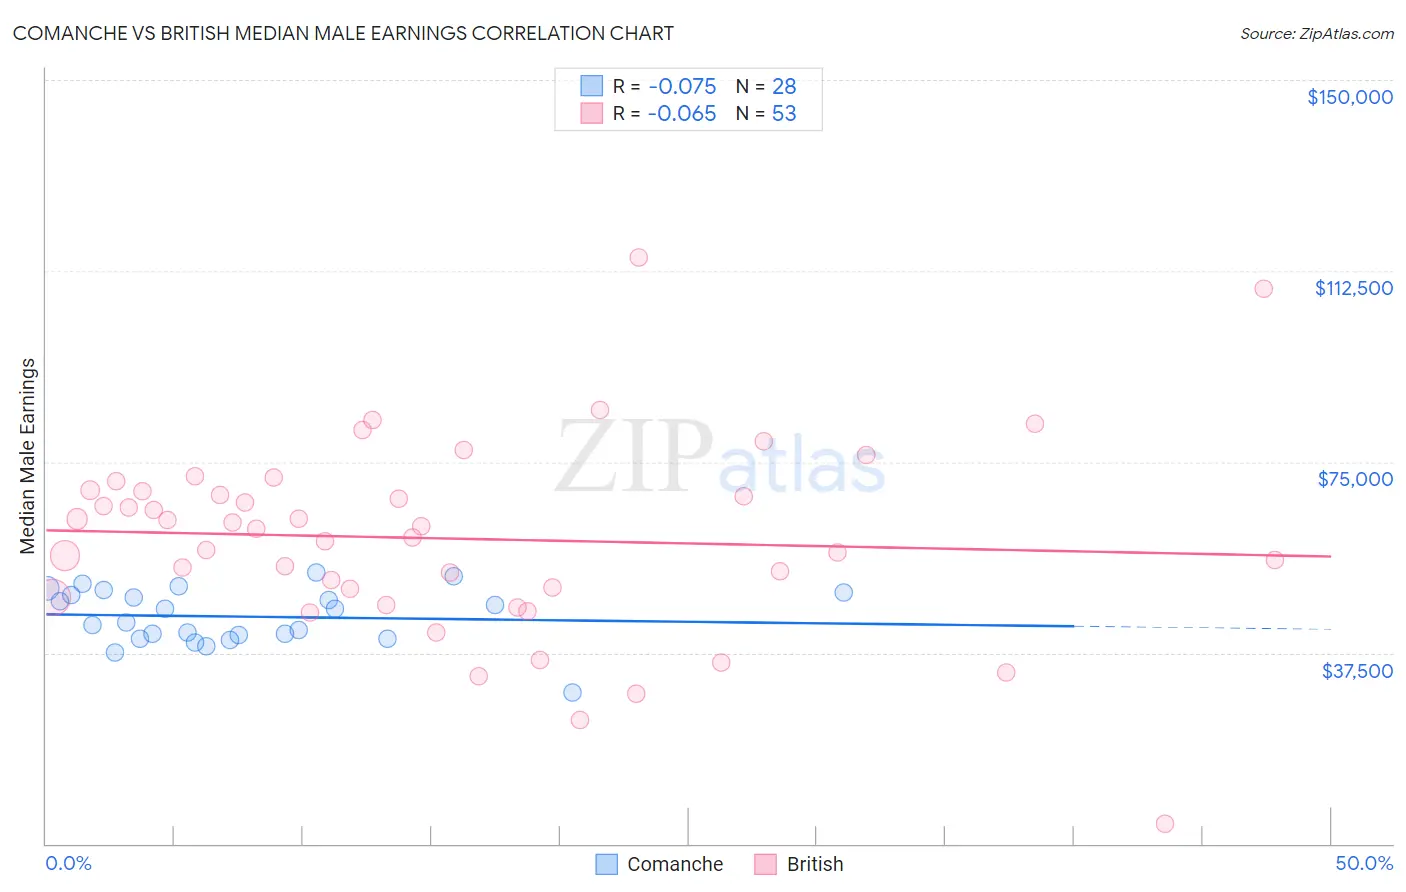
Comanche vs British Median Male Earnings Correlation Chart
The statistical analysis conducted on geographies consisting of 109,761,350 people shows a slight negative correlation between the proportion of Comanche and median male earnings in the United States with a correlation coefficient (R) of -0.075 and weighted average of $48,202. Similarly, the statistical analysis conducted on geographies consisting of 530,851,960 people shows a slight negative correlation between the proportion of British and median male earnings in the United States with a correlation coefficient (R) of -0.065 and weighted average of $57,890, a difference of 20.1%.
Median Male Earnings Correlation Summary
| Measurement | Comanche | British |
| Minimum | $29,698 | $3,957 |
| Maximum | $53,182 | $115,192 |
| Range | $23,484 | $111,235 |
| Mean | $44,594 | $59,934 |
| Median | $44,855 | $61,983 |
| Interquartile 25% (IQ1) | $40,605 | $49,275 |
| Interquartile 75% (IQ3) | $49,111 | $69,382 |
| Interquartile Range (IQR) | $8,506 | $20,107 |
| Standard Deviation (Sample) | $5,459 | $19,214 |
| Standard Deviation (Population) | $5,361 | $19,032 |
Similar Demographics by Median Male Earnings
Demographics Similar to Comanche by Median Male Earnings
In terms of median male earnings, the demographic groups most similar to Comanche are Hmong ($48,254, a difference of 0.11%), Marshallese ($48,137, a difference of 0.13%), Central American ($48,093, a difference of 0.23%), Immigrants from Liberia ($48,317, a difference of 0.24%), and Belizean ($48,358, a difference of 0.32%).
| Demographics | Rating | Rank | Median Male Earnings |
| Jamaicans | 0.3 /100 | #273 | Tragic $48,632 |
| Colville | 0.3 /100 | #274 | Tragic $48,516 |
| Immigrants | Somalia | 0.3 /100 | #275 | Tragic $48,439 |
| Blackfeet | 0.3 /100 | #276 | Tragic $48,402 |
| Belizeans | 0.2 /100 | #277 | Tragic $48,358 |
| Immigrants | Liberia | 0.2 /100 | #278 | Tragic $48,317 |
| Hmong | 0.2 /100 | #279 | Tragic $48,254 |
| Comanche | 0.2 /100 | #280 | Tragic $48,202 |
| Marshallese | 0.2 /100 | #281 | Tragic $48,137 |
| Central Americans | 0.2 /100 | #282 | Tragic $48,093 |
| Immigrants | Jamaica | 0.2 /100 | #283 | Tragic $48,040 |
| Africans | 0.2 /100 | #284 | Tragic $47,994 |
| Paiute | 0.2 /100 | #285 | Tragic $47,991 |
| Mexican American Indians | 0.2 /100 | #286 | Tragic $47,990 |
| Immigrants | El Salvador | 0.2 /100 | #287 | Tragic $47,973 |
Demographics Similar to British by Median Male Earnings
In terms of median male earnings, the demographic groups most similar to British are Immigrants from Uzbekistan ($57,941, a difference of 0.090%), Serbian ($57,975, a difference of 0.15%), Palestinian ($57,778, a difference of 0.19%), Immigrants from Northern Africa ($58,008, a difference of 0.20%), and Armenian ($58,134, a difference of 0.42%).
| Demographics | Rating | Rank | Median Male Earnings |
| Syrians | 97.4 /100 | #102 | Exceptional $58,187 |
| Poles | 97.3 /100 | #103 | Exceptional $58,139 |
| Armenians | 97.3 /100 | #104 | Exceptional $58,134 |
| Immigrants | Western Asia | 97.3 /100 | #105 | Exceptional $58,131 |
| Immigrants | Northern Africa | 96.9 /100 | #106 | Exceptional $58,008 |
| Serbians | 96.8 /100 | #107 | Exceptional $57,975 |
| Immigrants | Uzbekistan | 96.7 /100 | #108 | Exceptional $57,941 |
| British | 96.5 /100 | #109 | Exceptional $57,890 |
| Palestinians | 96.2 /100 | #110 | Exceptional $57,778 |
| Europeans | 95.6 /100 | #111 | Exceptional $57,637 |
| Immigrants | Afghanistan | 95.4 /100 | #112 | Exceptional $57,582 |
| Carpatho Rusyns | 95.3 /100 | #113 | Exceptional $57,572 |
| Immigrants | Kuwait | 95.3 /100 | #114 | Exceptional $57,562 |
| Swedes | 94.8 /100 | #115 | Exceptional $57,445 |
| Lebanese | 94.6 /100 | #116 | Exceptional $57,409 |