Malaysian vs British Median Male Earnings
COMPARE
Malaysian
British
Median Male Earnings
Median Male Earnings Comparison
Malaysians
British
$50,772
MEDIAN MALE EARNINGS
2.5/ 100
METRIC RATING
238th/ 347
METRIC RANK
$57,890
MEDIAN MALE EARNINGS
96.5/ 100
METRIC RATING
109th/ 347
METRIC RANK
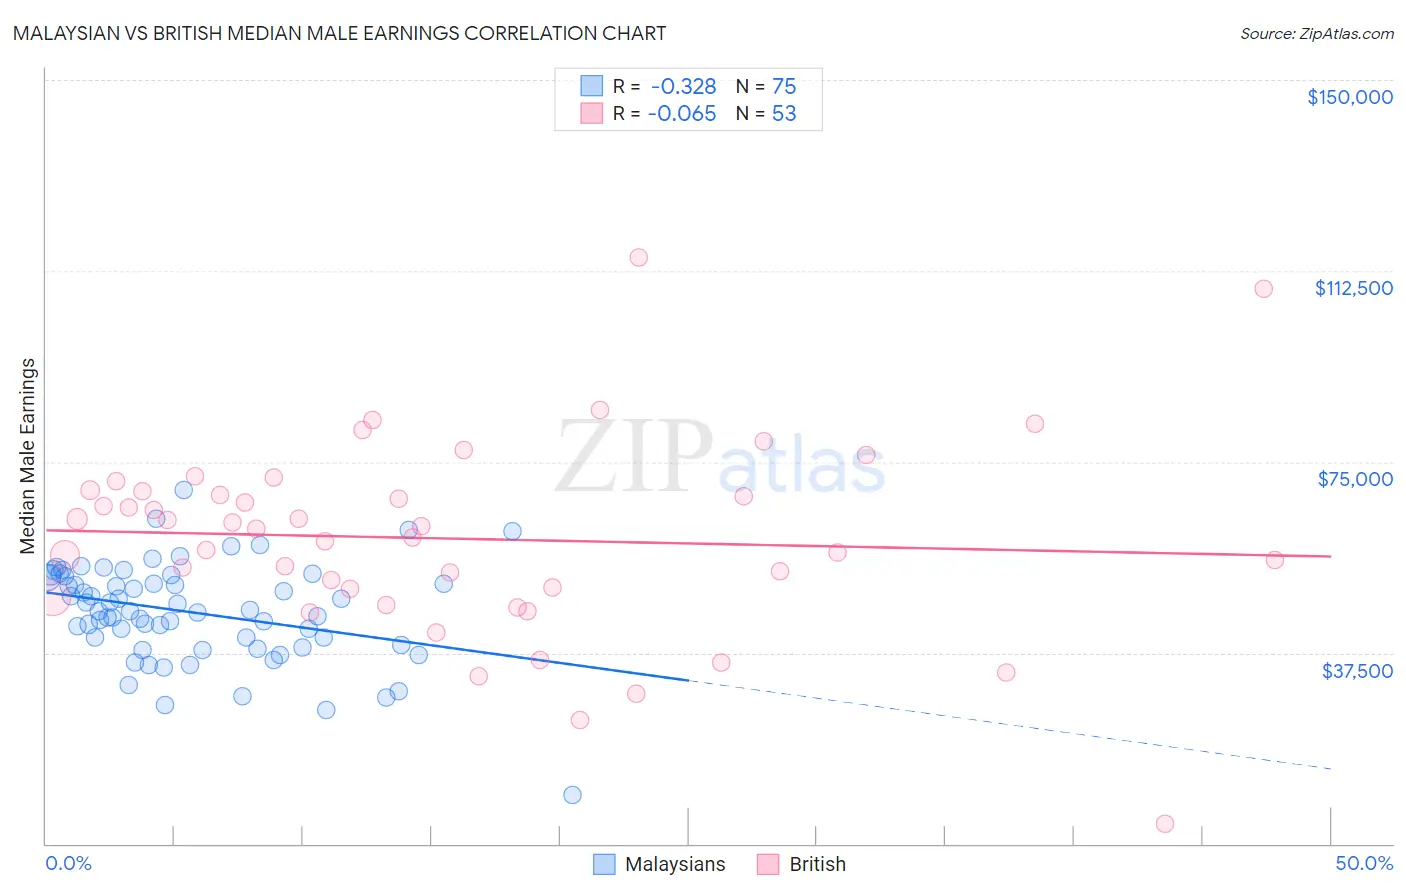
Malaysian vs British Median Male Earnings Correlation Chart
The statistical analysis conducted on geographies consisting of 226,097,760 people shows a mild negative correlation between the proportion of Malaysians and median male earnings in the United States with a correlation coefficient (R) of -0.328 and weighted average of $50,772. Similarly, the statistical analysis conducted on geographies consisting of 530,851,960 people shows a slight negative correlation between the proportion of British and median male earnings in the United States with a correlation coefficient (R) of -0.065 and weighted average of $57,890, a difference of 14.0%.
Median Male Earnings Correlation Summary
| Measurement | Malaysian | British |
| Minimum | $9,476 | $3,957 |
| Maximum | $69,480 | $115,192 |
| Range | $60,004 | $111,235 |
| Mean | $45,460 | $59,934 |
| Median | $45,623 | $61,983 |
| Interquartile 25% (IQ1) | $39,010 | $49,275 |
| Interquartile 75% (IQ3) | $52,552 | $69,382 |
| Interquartile Range (IQR) | $13,542 | $20,107 |
| Standard Deviation (Sample) | $9,782 | $19,214 |
| Standard Deviation (Population) | $9,717 | $19,032 |
Similar Demographics by Median Male Earnings
Demographics Similar to Malaysians by Median Male Earnings
In terms of median male earnings, the demographic groups most similar to Malaysians are American ($50,761, a difference of 0.020%), Immigrants from Barbados ($50,795, a difference of 0.050%), West Indian ($50,682, a difference of 0.18%), Pennsylvania German ($50,878, a difference of 0.21%), and Immigrants from St. Vincent and the Grenadines ($50,665, a difference of 0.21%).
| Demographics | Rating | Rank | Median Male Earnings |
| Barbadians | 3.9 /100 | #231 | Tragic $51,236 |
| Sudanese | 3.9 /100 | #232 | Tragic $51,216 |
| Aleuts | 3.7 /100 | #233 | Tragic $51,168 |
| Cape Verdeans | 3.5 /100 | #234 | Tragic $51,103 |
| Immigrants | Western Africa | 3.0 /100 | #235 | Tragic $50,940 |
| Pennsylvania Germans | 2.8 /100 | #236 | Tragic $50,878 |
| Immigrants | Barbados | 2.6 /100 | #237 | Tragic $50,795 |
| Malaysians | 2.5 /100 | #238 | Tragic $50,772 |
| Americans | 2.5 /100 | #239 | Tragic $50,761 |
| West Indians | 2.3 /100 | #240 | Tragic $50,682 |
| Immigrants | St. Vincent and the Grenadines | 2.3 /100 | #241 | Tragic $50,665 |
| Guyanese | 2.2 /100 | #242 | Tragic $50,613 |
| French American Indians | 2.2 /100 | #243 | Tragic $50,611 |
| Houma | 2.0 /100 | #244 | Tragic $50,547 |
| Hawaiians | 1.9 /100 | #245 | Tragic $50,488 |
Demographics Similar to British by Median Male Earnings
In terms of median male earnings, the demographic groups most similar to British are Immigrants from Uzbekistan ($57,941, a difference of 0.090%), Serbian ($57,975, a difference of 0.15%), Palestinian ($57,778, a difference of 0.19%), Immigrants from Northern Africa ($58,008, a difference of 0.20%), and Armenian ($58,134, a difference of 0.42%).
| Demographics | Rating | Rank | Median Male Earnings |
| Syrians | 97.4 /100 | #102 | Exceptional $58,187 |
| Poles | 97.3 /100 | #103 | Exceptional $58,139 |
| Armenians | 97.3 /100 | #104 | Exceptional $58,134 |
| Immigrants | Western Asia | 97.3 /100 | #105 | Exceptional $58,131 |
| Immigrants | Northern Africa | 96.9 /100 | #106 | Exceptional $58,008 |
| Serbians | 96.8 /100 | #107 | Exceptional $57,975 |
| Immigrants | Uzbekistan | 96.7 /100 | #108 | Exceptional $57,941 |
| British | 96.5 /100 | #109 | Exceptional $57,890 |
| Palestinians | 96.2 /100 | #110 | Exceptional $57,778 |
| Europeans | 95.6 /100 | #111 | Exceptional $57,637 |
| Immigrants | Afghanistan | 95.4 /100 | #112 | Exceptional $57,582 |
| Carpatho Rusyns | 95.3 /100 | #113 | Exceptional $57,572 |
| Immigrants | Kuwait | 95.3 /100 | #114 | Exceptional $57,562 |
| Swedes | 94.8 /100 | #115 | Exceptional $57,445 |
| Lebanese | 94.6 /100 | #116 | Exceptional $57,409 |