Colville vs Hopi Householder Income Ages 25 - 44 years
COMPARE
Colville
Hopi
Householder Income Ages 25 - 44 years
Householder Income Ages 25 - 44 years Comparison
Colville
Hopi
$82,604
HOUSEHOLDER INCOME AGES 25 - 44 YEARS
0.1/ 100
METRIC RATING
280th/ 347
METRIC RANK
$75,002
HOUSEHOLDER INCOME AGES 25 - 44 YEARS
0.0/ 100
METRIC RATING
333rd/ 347
METRIC RANK
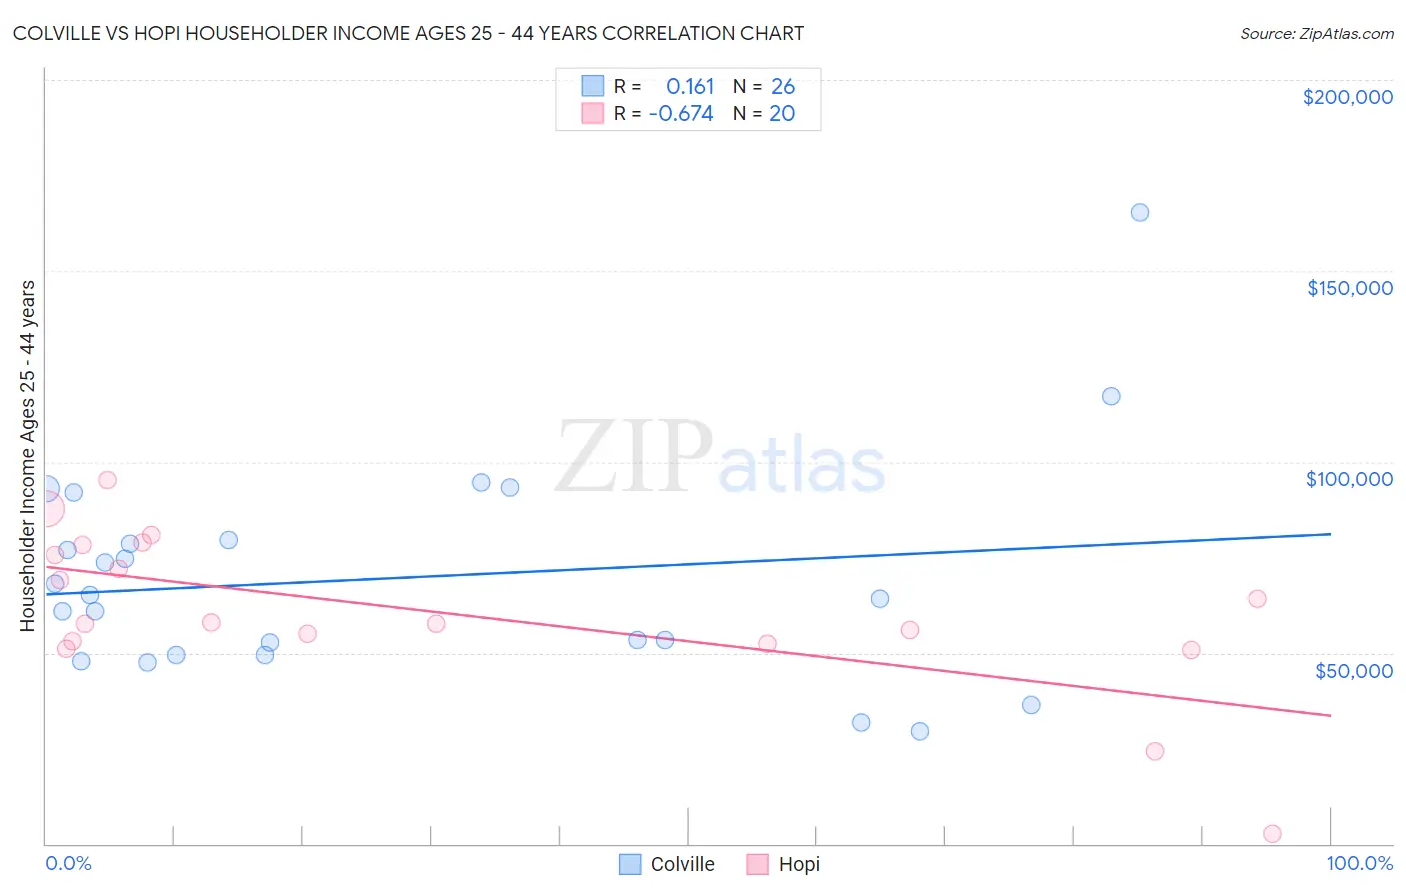
Colville vs Hopi Householder Income Ages 25 - 44 years Correlation Chart
The statistical analysis conducted on geographies consisting of 34,657,772 people shows a poor positive correlation between the proportion of Colville and household income with householder between the ages 25 and 44 in the United States with a correlation coefficient (R) of 0.161 and weighted average of $82,604. Similarly, the statistical analysis conducted on geographies consisting of 74,668,880 people shows a significant negative correlation between the proportion of Hopi and household income with householder between the ages 25 and 44 in the United States with a correlation coefficient (R) of -0.674 and weighted average of $75,002, a difference of 10.1%.
Householder Income Ages 25 - 44 years Correlation Summary
| Measurement | Colville | Hopi |
| Minimum | $29,375 | $2,499 |
| Maximum | $165,278 | $95,278 |
| Range | $135,903 | $92,779 |
| Mean | $69,577 | $61,016 |
| Median | $64,641 | $57,812 |
| Interquartile 25% (IQ1) | $49,583 | $52,840 |
| Interquartile 75% (IQ3) | $79,688 | $76,984 |
| Interquartile Range (IQR) | $30,105 | $24,144 |
| Standard Deviation (Sample) | $28,891 | $21,159 |
| Standard Deviation (Population) | $28,330 | $20,623 |
Similar Demographics by Householder Income Ages 25 - 44 years
Demographics Similar to Colville by Householder Income Ages 25 - 44 years
In terms of householder income ages 25 - 44 years, the demographic groups most similar to Colville are Pima ($82,821, a difference of 0.26%), Cajun ($82,393, a difference of 0.26%), Senegalese ($82,852, a difference of 0.30%), Central American Indian ($82,355, a difference of 0.30%), and Guatemalan ($82,331, a difference of 0.33%).
| Demographics | Rating | Rank | Householder Income Ages 25 - 44 years |
| Iroquois | 0.2 /100 | #273 | Tragic $83,682 |
| Marshallese | 0.2 /100 | #274 | Tragic $83,575 |
| Immigrants | Jamaica | 0.2 /100 | #275 | Tragic $83,298 |
| Immigrants | Belize | 0.2 /100 | #276 | Tragic $83,141 |
| Paiute | 0.2 /100 | #277 | Tragic $82,984 |
| Senegalese | 0.2 /100 | #278 | Tragic $82,852 |
| Pima | 0.1 /100 | #279 | Tragic $82,821 |
| Colville | 0.1 /100 | #280 | Tragic $82,604 |
| Cajuns | 0.1 /100 | #281 | Tragic $82,393 |
| Central American Indians | 0.1 /100 | #282 | Tragic $82,355 |
| Guatemalans | 0.1 /100 | #283 | Tragic $82,331 |
| Immigrants | Middle Africa | 0.1 /100 | #284 | Tragic $82,254 |
| Immigrants | Somalia | 0.1 /100 | #285 | Tragic $82,188 |
| Ute | 0.1 /100 | #286 | Tragic $82,166 |
| Immigrants | Latin America | 0.1 /100 | #287 | Tragic $82,166 |
Demographics Similar to Hopi by Householder Income Ages 25 - 44 years
In terms of householder income ages 25 - 44 years, the demographic groups most similar to Hopi are Creek ($74,847, a difference of 0.21%), Kiowa ($74,776, a difference of 0.30%), Bahamian ($75,395, a difference of 0.52%), Native/Alaskan ($75,647, a difference of 0.86%), and Yakama ($76,226, a difference of 1.6%).
| Demographics | Rating | Rank | Householder Income Ages 25 - 44 years |
| Houma | 0.0 /100 | #326 | Tragic $77,044 |
| Immigrants | Bahamas | 0.0 /100 | #327 | Tragic $76,910 |
| Immigrants | Cuba | 0.0 /100 | #328 | Tragic $76,701 |
| Seminole | 0.0 /100 | #329 | Tragic $76,584 |
| Yakama | 0.0 /100 | #330 | Tragic $76,226 |
| Natives/Alaskans | 0.0 /100 | #331 | Tragic $75,647 |
| Bahamians | 0.0 /100 | #332 | Tragic $75,395 |
| Hopi | 0.0 /100 | #333 | Tragic $75,002 |
| Creek | 0.0 /100 | #334 | Tragic $74,847 |
| Kiowa | 0.0 /100 | #335 | Tragic $74,776 |
| Yup'ik | 0.0 /100 | #336 | Tragic $73,688 |
| Blacks/African Americans | 0.0 /100 | #337 | Tragic $73,370 |
| Immigrants | Yemen | 0.0 /100 | #338 | Tragic $73,043 |
| Yuman | 0.0 /100 | #339 | Tragic $72,956 |
| Immigrants | Congo | 0.0 /100 | #340 | Tragic $72,178 |