Colville vs Pima Householder Income Ages 25 - 44 years
COMPARE
Colville
Pima
Householder Income Ages 25 - 44 years
Householder Income Ages 25 - 44 years Comparison
Colville
Pima
$82,604
HOUSEHOLDER INCOME AGES 25 - 44 YEARS
0.1/ 100
METRIC RATING
280th/ 347
METRIC RANK
$82,821
HOUSEHOLDER INCOME AGES 25 - 44 YEARS
0.1/ 100
METRIC RATING
279th/ 347
METRIC RANK
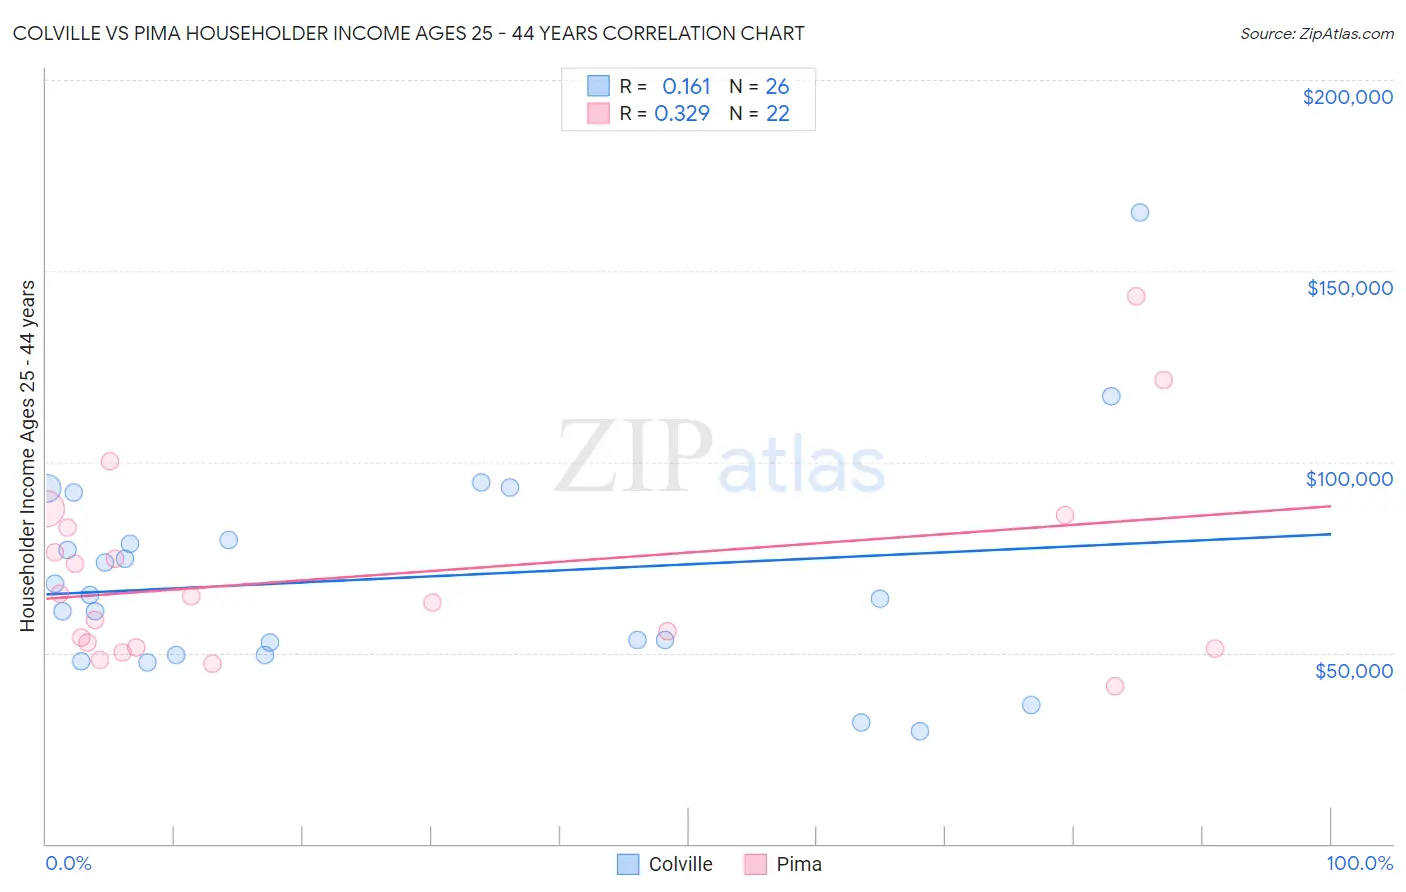
Colville vs Pima Householder Income Ages 25 - 44 years Correlation Chart
The statistical analysis conducted on geographies consisting of 34,657,772 people shows a poor positive correlation between the proportion of Colville and household income with householder between the ages 25 and 44 in the United States with a correlation coefficient (R) of 0.161 and weighted average of $82,604. Similarly, the statistical analysis conducted on geographies consisting of 61,441,839 people shows a mild positive correlation between the proportion of Pima and household income with householder between the ages 25 and 44 in the United States with a correlation coefficient (R) of 0.329 and weighted average of $82,821, a difference of 0.26%.
Householder Income Ages 25 - 44 years Correlation Summary
| Measurement | Colville | Pima |
| Minimum | $29,375 | $41,167 |
| Maximum | $165,278 | $143,258 |
| Range | $135,903 | $102,091 |
| Mean | $69,577 | $70,457 |
| Median | $64,641 | $64,038 |
| Interquartile 25% (IQ1) | $49,583 | $51,500 |
| Interquartile 75% (IQ3) | $79,688 | $82,898 |
| Interquartile Range (IQR) | $30,105 | $31,398 |
| Standard Deviation (Sample) | $28,891 | $25,507 |
| Standard Deviation (Population) | $28,330 | $24,921 |
Demographics Similar to Colville and Pima by Householder Income Ages 25 - 44 years
In terms of householder income ages 25 - 44 years, the demographic groups most similar to Colville are Cajun ($82,393, a difference of 0.26%), Senegalese ($82,852, a difference of 0.30%), Central American Indian ($82,355, a difference of 0.30%), Guatemalan ($82,331, a difference of 0.33%), and Immigrants from Middle Africa ($82,254, a difference of 0.43%). Similarly, the demographic groups most similar to Pima are Senegalese ($82,852, a difference of 0.040%), Paiute ($82,984, a difference of 0.20%), Immigrants from Belize ($83,141, a difference of 0.39%), Cajun ($82,393, a difference of 0.52%), and Central American Indian ($82,355, a difference of 0.57%).
| Demographics | Rating | Rank | Householder Income Ages 25 - 44 years |
| Spanish American Indians | 0.3 /100 | #269 | Tragic $84,085 |
| Jamaicans | 0.3 /100 | #270 | Tragic $83,933 |
| Somalis | 0.2 /100 | #271 | Tragic $83,752 |
| Spanish Americans | 0.2 /100 | #272 | Tragic $83,722 |
| Iroquois | 0.2 /100 | #273 | Tragic $83,682 |
| Marshallese | 0.2 /100 | #274 | Tragic $83,575 |
| Immigrants | Jamaica | 0.2 /100 | #275 | Tragic $83,298 |
| Immigrants | Belize | 0.2 /100 | #276 | Tragic $83,141 |
| Paiute | 0.2 /100 | #277 | Tragic $82,984 |
| Senegalese | 0.2 /100 | #278 | Tragic $82,852 |
| Pima | 0.1 /100 | #279 | Tragic $82,821 |
| Colville | 0.1 /100 | #280 | Tragic $82,604 |
| Cajuns | 0.1 /100 | #281 | Tragic $82,393 |
| Central American Indians | 0.1 /100 | #282 | Tragic $82,355 |
| Guatemalans | 0.1 /100 | #283 | Tragic $82,331 |
| Immigrants | Middle Africa | 0.1 /100 | #284 | Tragic $82,254 |
| Immigrants | Somalia | 0.1 /100 | #285 | Tragic $82,188 |
| Ute | 0.1 /100 | #286 | Tragic $82,166 |
| Immigrants | Latin America | 0.1 /100 | #287 | Tragic $82,166 |
| Comanche | 0.1 /100 | #288 | Tragic $82,152 |
| Shoshone | 0.1 /100 | #289 | Tragic $82,062 |