Immigrants from Cambodia vs Hopi Householder Income Ages 25 - 44 years

COMPARE

Immigrants from Cambodia
Race
Ancestry
AfghanAfricanAlaska NativeAlaskan AthabascanAlbanianAleutAlsatianAmericanApacheArabArapahoArgentineanArmenianAssyrian/Chaldean/SyriacAustralianAustrianBahamianBangladeshiBarbadianBasqueBelgianBelizeanBermudanBhutaneseBlackfeetBolivianBrazilianBritishBritish West IndianBulgarianBurmeseCajunCambodianCanadianCape VerdeanCarpatho RusynCelticCentral AmericanCentral American IndianCherokeeCheyenneChickasawChileanChineseChippewaChoctawColombianColvilleComancheCosta RicanCreeCreekCroatianCrowCubanCypriotCzechCzechoslovakianDanishDelawareDominicanDutchDutch West IndianEastern EuropeanEcuadorianEgyptianEnglishEstonianEthiopianEuropeanFijianFilipinoFinnishFrenchFrench American IndianFrench CanadianGermanGerman RussianGhanaianGreekGuamanian/ChamorroGuatemalanGuyaneseHaitianHmongHonduranHoumaHungarianIcelanderIndian (Asian)IndonesianInupiatIranianIraqiIrishIroquoisIsraeliItalianJamaicanJapaneseJordanianKenyanKiowaKoreanLaotianLatvianLebaneseLiberianLithuanianLumbeeLuxembourgerMacedonianMalaysianMalteseMarshalleseMenomineeMexicanMexican American IndianMongolianMoroccanNative HawaiianNavajoNepaleseNew ZealanderNicaraguanNigerianNorthern EuropeanNorwegianOkinawanOsageOttawaPaiutePakistaniPalestinianPanamanianParaguayanPennsylvania GermanPeruvianPimaPolishPortuguesePotawatomiPuebloPuerto RicanPuget Sound SalishRomanianRussianSalvadoranSamoanScandinavianScotch-IrishScottishSeminoleSenegaleseSerbianShoshoneSierra LeoneanSiouxSlavicSlovakSloveneSomaliSouth AfricanSouth AmericanSouth American IndianSoviet UnionSpaniardSpanishSpanish AmericanSpanish American IndianSri LankanSubsaharan AfricanSudaneseSwedishSwissSyrianTaiwaneseThaiTlingit-HaidaTohono O'OdhamTonganTrinidadian and TobagonianTsimshianTurkishU.S. Virgin IslanderUgandanUkrainianUruguayanUteVenezuelanVietnameseWelshWest IndianYakamaYaquiYugoslavianYumanYup'ikZimbabwean
Immigration
NonimmigrantsImmigrantsAfghanistanAfricaAlbaniaArgentinaArmeniaAsiaAustraliaAustriaBahamasBangladeshBarbadosBelarusBelgiumBelizeBoliviaBosnia and HerzegovinaBrazilBulgariaBurma/MyanmarCabo VerdeCambodiaCameroonCanadaCaribbeanCentral AmericaChileChinaColombiaCongoCosta RicaCroatiaCubaCzechoslovakiaDenmarkDominicaDominican RepublicEastern AfricaEastern AsiaEastern EuropeEcuadorEgyptEl SalvadorEnglandEritreaEthiopiaEuropeFijiFranceGermanyGhanaGreeceGrenadaGuatemalaGuyanaHaitiHondurasHong KongHungaryIndiaIndonesiaIranIraqIrelandIsraelItalyJamaicaJapanJordanKazakhstanKenyaKoreaKuwaitLaosLatin AmericaLatviaLebanonLiberiaLithuaniaMalaysiaMexicoMicronesiaMiddle AfricaMoldovaMoroccoNepalNetherlandsNicaraguaNigeriaNorth AmericaNorth MacedoniaNorthern AfricaNorthern EuropeNorwayOceaniaPakistanPanamaPeruPhilippinesPolandPortugalRomaniaRussiaSaudi ArabiaScotlandSenegalSerbiaSierra LeoneSingaporeSomaliaSouth AfricaSouth AmericaSouth Central AsiaSouth Eastern AsiaSouthern EuropeSpainSri LankaSt. Vincent and the GrenadinesSudanSwedenSwitzerlandSyriaTaiwanThailandTrinidad and TobagoTurkeyUgandaUkraineUruguayUzbekistanVenezuelaVietnamWest IndiesWestern AfricaWestern AsiaWestern EuropeYemenZaireZimbabweAzores
Hopi
Race
Ancestry
AfghanAfricanAlaska NativeAlaskan AthabascanAlbanianAleutAlsatianAmericanApacheArabArapahoArgentineanArmenianAssyrian/Chaldean/SyriacAustralianAustrianBahamianBangladeshiBarbadianBasqueBelgianBelizeanBermudanBhutaneseBlackfeetBolivianBrazilianBritishBritish West IndianBulgarianBurmeseCajunCambodianCanadianCape VerdeanCarpatho RusynCelticCentral AmericanCentral American IndianCherokeeCheyenneChickasawChileanChineseChippewaChoctawColombianColvilleComancheCosta RicanCreeCreekCroatianCrowCubanCypriotCzechCzechoslovakianDanishDelawareDominicanDutchDutch West IndianEastern EuropeanEcuadorianEgyptianEnglishEstonianEthiopianEuropeanFijianFilipinoFinnishFrenchFrench American IndianFrench CanadianGermanGerman RussianGhanaianGreekGuamanian/ChamorroGuatemalanGuyaneseHaitianHmongHonduranHopiHoumaHungarianIcelanderIndian (Asian)IndonesianInupiatIranianIraqiIrishIroquoisIsraeliItalianJamaicanJapaneseJordanianKenyanKiowaKoreanLaotianLatvianLebaneseLiberianLithuanianLumbeeLuxembourgerMacedonianMalaysianMalteseMarshalleseMenomineeMexicanMexican American IndianMongolianMoroccanNative HawaiianNavajoNepaleseNew ZealanderNicaraguanNigerianNorthern EuropeanNorwegianOkinawanOsageOttawaPaiutePakistaniPalestinianPanamanianParaguayanPennsylvania GermanPeruvianPimaPolishPortuguesePotawatomiPuebloPuerto RicanPuget Sound SalishRomanianRussianSalvadoranSamoanScandinavianScotch-IrishScottishSeminoleSenegaleseSerbianShoshoneSierra LeoneanSiouxSlavicSlovakSloveneSomaliSouth AfricanSouth AmericanSouth American IndianSoviet UnionSpaniardSpanishSpanish AmericanSpanish American IndianSri LankanSubsaharan AfricanSudaneseSwedishSwissSyrianTaiwaneseThaiTlingit-HaidaTohono O'OdhamTonganTrinidadian and TobagonianTsimshianTurkishU.S. Virgin IslanderUgandanUkrainianUruguayanUteVenezuelanVietnameseWelshWest IndianYakamaYaquiYugoslavianYumanYup'ikZimbabwean
Immigration
NonimmigrantsImmigrantsAfghanistanAfricaAlbaniaArgentinaArmeniaAsiaAustraliaAustriaBahamasBangladeshBarbadosBelarusBelgiumBelizeBoliviaBosnia and HerzegovinaBrazilBulgariaBurma/MyanmarCabo VerdeCameroonCanadaCaribbeanCentral AmericaChileChinaColombiaCongoCosta RicaCroatiaCubaCzechoslovakiaDenmarkDominicaDominican RepublicEastern AfricaEastern AsiaEastern EuropeEcuadorEgyptEl SalvadorEnglandEritreaEthiopiaEuropeFijiFranceGermanyGhanaGreeceGrenadaGuatemalaGuyanaHaitiHondurasHong KongHungaryIndiaIndonesiaIranIraqIrelandIsraelItalyJamaicaJapanJordanKazakhstanKenyaKoreaKuwaitLaosLatin AmericaLatviaLebanonLiberiaLithuaniaMalaysiaMexicoMicronesiaMiddle AfricaMoldovaMoroccoNepalNetherlandsNicaraguaNigeriaNorth AmericaNorth MacedoniaNorthern AfricaNorthern EuropeNorwayOceaniaPakistanPanamaPeruPhilippinesPolandPortugalRomaniaRussiaSaudi ArabiaScotlandSenegalSerbiaSierra LeoneSingaporeSomaliaSouth AfricaSouth AmericaSouth Central AsiaSouth Eastern AsiaSouthern EuropeSpainSri LankaSt. Vincent and the GrenadinesSudanSwedenSwitzerlandSyriaTaiwanThailandTrinidad and TobagoTurkeyUgandaUkraineUruguayUzbekistanVenezuelaVietnamWest IndiesWestern AfricaWestern AsiaWestern EuropeYemenZaireZimbabweAzores
Householder Income Ages 25 - 44 years
Income
Poverty
Unemployment
Labor Participation
Family Structure
Vehicle Availability
Education Level
Disability

Householder Income Ages 25 - 44 years Comparison

Immigrants from Cambodia

Hopi

Poor
Tragic
$91,533
HOUSEHOLDER INCOME AGES 25 - 44 YEARS
15.7/ 100
METRIC RATING
203rd/ 347
METRIC RANK
$75,002
HOUSEHOLDER INCOME AGES 25 - 44 YEARS
0.0/ 100
METRIC RATING
333rd/ 347
METRIC RANK

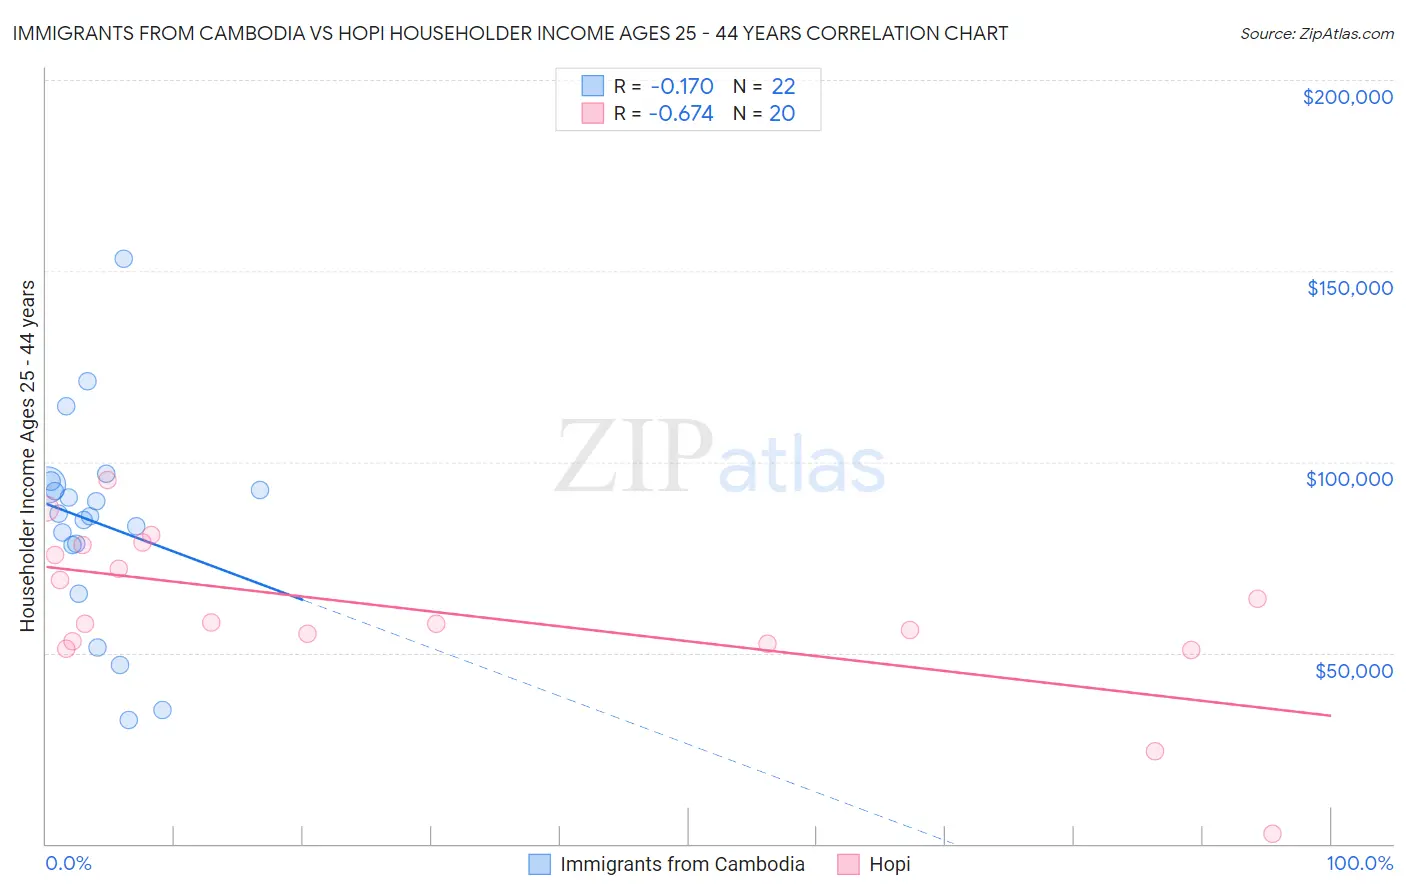
Immigrants from Cambodia vs Hopi Householder Income Ages 25 - 44 years Correlation Chart

The statistical analysis conducted on geographies consisting of 205,045,995 people shows a poor negative correlation between the proportion of Immigrants from Cambodia and household income with householder between the ages 25 and 44 in the United States with a correlation coefficient (R) of -0.170 and weighted average of $91,533. Similarly, the statistical analysis conducted on geographies consisting of 74,668,880 people shows a significant negative correlation between the proportion of Hopi and household income with householder between the ages 25 and 44 in the United States with a correlation coefficient (R) of -0.674 and weighted average of $75,002, a difference of 22.0%.
Immigrants from Cambodia vs Hopi Householder Income Ages 25 - 44 years

Householder Income Ages 25 - 44 years Correlation Summary

MeasurementImmigrants from CambodiaHopi
Minimum$32,434$2,499
Maximum$153,083$95,278
Range$120,649$92,779
Mean$84,078$61,016
Median$86,079$57,812
Interquartile 25% (IQ1)$78,256$52,840
Interquartile 75% (IQ3)$93,913$76,984
Interquartile Range (IQR)$15,657$24,144
Standard Deviation (Sample)$27,275$21,159
Standard Deviation (Population)$26,648$20,623

Similar Demographics by Householder Income Ages 25 - 44 years

Demographics Similar to Immigrants from Cambodia by Householder Income Ages 25 - 44 years

In terms of householder income ages 25 - 44 years, the demographic groups most similar to Immigrants from Cambodia are Ecuadorian ($91,574, a difference of 0.040%), Nepalese ($91,498, a difference of 0.040%), Immigrants from Eastern Africa ($91,458, a difference of 0.080%), Japanese ($91,624, a difference of 0.10%), and White/Caucasian ($91,668, a difference of 0.15%).
DemographicsRating | RankHouseholder Income Ages 25 - 44 years
Immigrants | Colombia
21.3
/100
|
#196
Fair
$92,204
Spanish
21.2
/100
|
#197
Fair
$92,200
Vietnamese
20.2
/100
|
#198
Fair
$92,089
Kenyans
16.8
/100
|
#199
Poor
$91,684
Whites/Caucasians
16.7
/100
|
#200
Poor
$91,668
Japanese
16.4
/100
|
#201
Poor
$91,624
Ecuadorians
16.0
/100
|
#202
Poor
$91,574
Immigrants | Cambodia
15.7
/100
|
#203
Poor
$91,533
Nepalese
15.4
/100
|
#204
Poor
$91,498
Immigrants | Eastern Africa
15.2
/100
|
#205
Poor
$91,458
Aleuts
14.5
/100
|
#206
Poor
$91,370
Yugoslavians
14.5
/100
|
#207
Poor
$91,368
Immigrants | Thailand
14.3
/100
|
#208
Poor
$91,337
Immigrants | Uruguay
13.2
/100
|
#209
Poor
$91,171
Immigrants | Kenya
10.9
/100
|
#210
Poor
$90,767

Demographics Similar to Hopi by Householder Income Ages 25 - 44 years

In terms of householder income ages 25 - 44 years, the demographic groups most similar to Hopi are Creek ($74,847, a difference of 0.21%), Kiowa ($74,776, a difference of 0.30%), Bahamian ($75,395, a difference of 0.52%), Native/Alaskan ($75,647, a difference of 0.86%), and Yakama ($76,226, a difference of 1.6%).
DemographicsRating | RankHouseholder Income Ages 25 - 44 years
Houma
0.0
/100
|
#326
Tragic
$77,044
Immigrants | Bahamas
0.0
/100
|
#327
Tragic
$76,910
Immigrants | Cuba
0.0
/100
|
#328
Tragic
$76,701
Seminole
0.0
/100
|
#329
Tragic
$76,584
Yakama
0.0
/100
|
#330
Tragic
$76,226
Natives/Alaskans
0.0
/100
|
#331
Tragic
$75,647
Bahamians
0.0
/100
|
#332
Tragic
$75,395
Hopi
0.0
/100
|
#333
Tragic
$75,002
Creek
0.0
/100
|
#334
Tragic
$74,847
Kiowa
0.0
/100
|
#335
Tragic
$74,776
Yup'ik
0.0
/100
|
#336
Tragic
$73,688
Blacks/African Americans
0.0
/100
|
#337
Tragic
$73,370
Immigrants | Yemen
0.0
/100
|
#338
Tragic
$73,043
Yuman
0.0
/100
|
#339
Tragic
$72,956
Immigrants | Congo
0.0
/100
|
#340
Tragic
$72,178