Colombian vs Immigrants from Guyana Householder Income Under 25 years
COMPARE
Colombian
Immigrants from Guyana
Householder Income Under 25 years
Householder Income Under 25 years Comparison
Colombians
Immigrants from Guyana
$53,357
HOUSEHOLDER INCOME UNDER 25 YEARS
94.6/ 100
METRIC RATING
124th/ 347
METRIC RANK
$55,726
HOUSEHOLDER INCOME UNDER 25 YEARS
100.0/ 100
METRIC RATING
41st/ 347
METRIC RANK
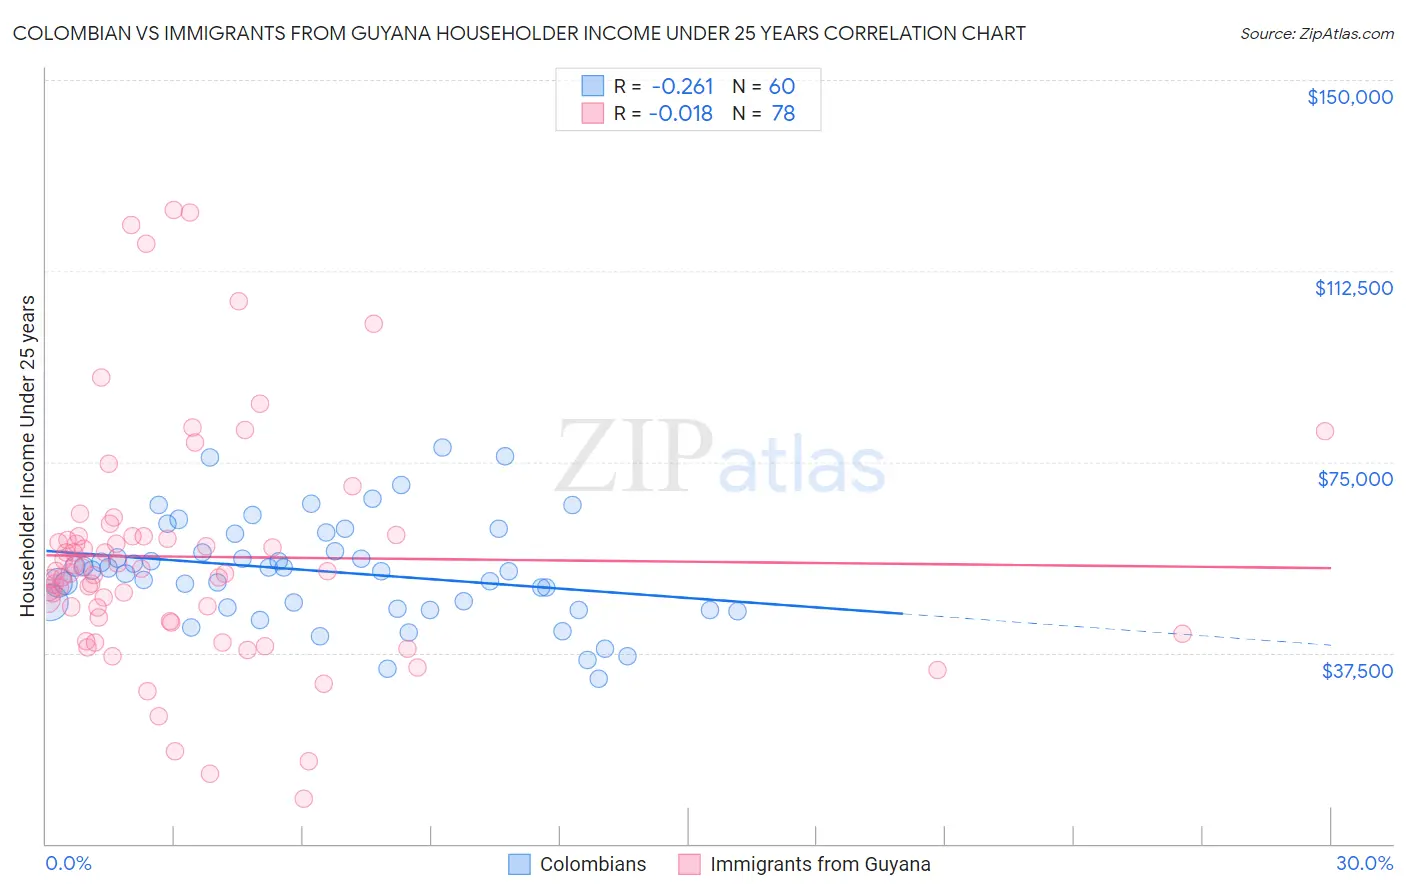
Colombian vs Immigrants from Guyana Householder Income Under 25 years Correlation Chart
The statistical analysis conducted on geographies consisting of 350,831,291 people shows a weak negative correlation between the proportion of Colombians and household income with householder under the age of 25 in the United States with a correlation coefficient (R) of -0.261 and weighted average of $53,357. Similarly, the statistical analysis conducted on geographies consisting of 159,030,692 people shows no correlation between the proportion of Immigrants from Guyana and household income with householder under the age of 25 in the United States with a correlation coefficient (R) of -0.018 and weighted average of $55,726, a difference of 4.4%.
Householder Income Under 25 years Correlation Summary
| Measurement | Colombian | Immigrants from Guyana |
| Minimum | $32,315 | $8,838 |
| Maximum | $77,798 | $124,392 |
| Range | $45,483 | $115,554 |
| Mean | $53,495 | $56,359 |
| Median | $53,679 | $53,366 |
| Interquartile 25% (IQ1) | $46,265 | $43,724 |
| Interquartile 75% (IQ3) | $59,118 | $60,316 |
| Interquartile Range (IQR) | $12,853 | $16,592 |
| Standard Deviation (Sample) | $10,089 | $23,247 |
| Standard Deviation (Population) | $10,004 | $23,098 |
Similar Demographics by Householder Income Under 25 years
Demographics Similar to Colombians by Householder Income Under 25 years
In terms of householder income under 25 years, the demographic groups most similar to Colombians are Immigrants from Iraq ($53,384, a difference of 0.050%), Pakistani ($53,325, a difference of 0.060%), Immigrants from Serbia ($53,321, a difference of 0.070%), Immigrants from North America ($53,307, a difference of 0.090%), and Immigrants from Canada ($53,411, a difference of 0.10%).
| Demographics | Rating | Rank | Householder Income Under 25 years |
| Lithuanians | 96.6 /100 | #117 | Exceptional $53,552 |
| Immigrants | Switzerland | 96.3 /100 | #118 | Exceptional $53,528 |
| Italians | 95.4 /100 | #119 | Exceptional $53,426 |
| Guamanians/Chamorros | 95.3 /100 | #120 | Exceptional $53,423 |
| Immigrants | Canada | 95.2 /100 | #121 | Exceptional $53,411 |
| Immigrants | Ethiopia | 95.2 /100 | #122 | Exceptional $53,408 |
| Immigrants | Iraq | 94.9 /100 | #123 | Exceptional $53,384 |
| Colombians | 94.6 /100 | #124 | Exceptional $53,357 |
| Pakistanis | 94.1 /100 | #125 | Exceptional $53,325 |
| Immigrants | Serbia | 94.1 /100 | #126 | Exceptional $53,321 |
| Immigrants | North America | 93.9 /100 | #127 | Exceptional $53,307 |
| Immigrants | Bulgaria | 93.9 /100 | #128 | Exceptional $53,305 |
| New Zealanders | 93.7 /100 | #129 | Exceptional $53,294 |
| Nicaraguans | 93.4 /100 | #130 | Exceptional $53,275 |
| Immigrants | Nicaragua | 93.3 /100 | #131 | Exceptional $53,266 |
Demographics Similar to Immigrants from Guyana by Householder Income Under 25 years
In terms of householder income under 25 years, the demographic groups most similar to Immigrants from Guyana are Immigrants from Greece ($55,727, a difference of 0.0%), Immigrants from Korea ($55,716, a difference of 0.020%), Immigrants from South Eastern Asia ($55,714, a difference of 0.020%), Immigrants from Belarus ($55,743, a difference of 0.030%), and Paraguayan ($55,614, a difference of 0.20%).
| Demographics | Rating | Rank | Householder Income Under 25 years |
| Immigrants | Japan | 100.0 /100 | #34 | Exceptional $55,932 |
| Tlingit-Haida | 100.0 /100 | #35 | Exceptional $55,914 |
| Immigrants | Israel | 100.0 /100 | #36 | Exceptional $55,913 |
| Immigrants | Russia | 100.0 /100 | #37 | Exceptional $55,891 |
| Immigrants | Iran | 100.0 /100 | #38 | Exceptional $55,880 |
| Immigrants | Belarus | 100.0 /100 | #39 | Exceptional $55,743 |
| Immigrants | Greece | 100.0 /100 | #40 | Exceptional $55,727 |
| Immigrants | Guyana | 100.0 /100 | #41 | Exceptional $55,726 |
| Immigrants | Korea | 100.0 /100 | #42 | Exceptional $55,716 |
| Immigrants | South Eastern Asia | 100.0 /100 | #43 | Exceptional $55,714 |
| Paraguayans | 100.0 /100 | #44 | Exceptional $55,614 |
| Spanish American Indians | 100.0 /100 | #45 | Exceptional $55,573 |
| Immigrants | Eastern Europe | 100.0 /100 | #46 | Exceptional $55,572 |
| Cambodians | 100.0 /100 | #47 | Exceptional $55,571 |
| Immigrants | Vietnam | 100.0 /100 | #48 | Exceptional $55,562 |