Choctaw vs Laotian Median Male Earnings
COMPARE
Choctaw
Laotian
Median Male Earnings
Median Male Earnings Comparison
Choctaw
Laotians
$47,729
MEDIAN MALE EARNINGS
0.1/ 100
METRIC RATING
291st/ 347
METRIC RANK
$59,351
MEDIAN MALE EARNINGS
99.2/ 100
METRIC RATING
91st/ 347
METRIC RANK
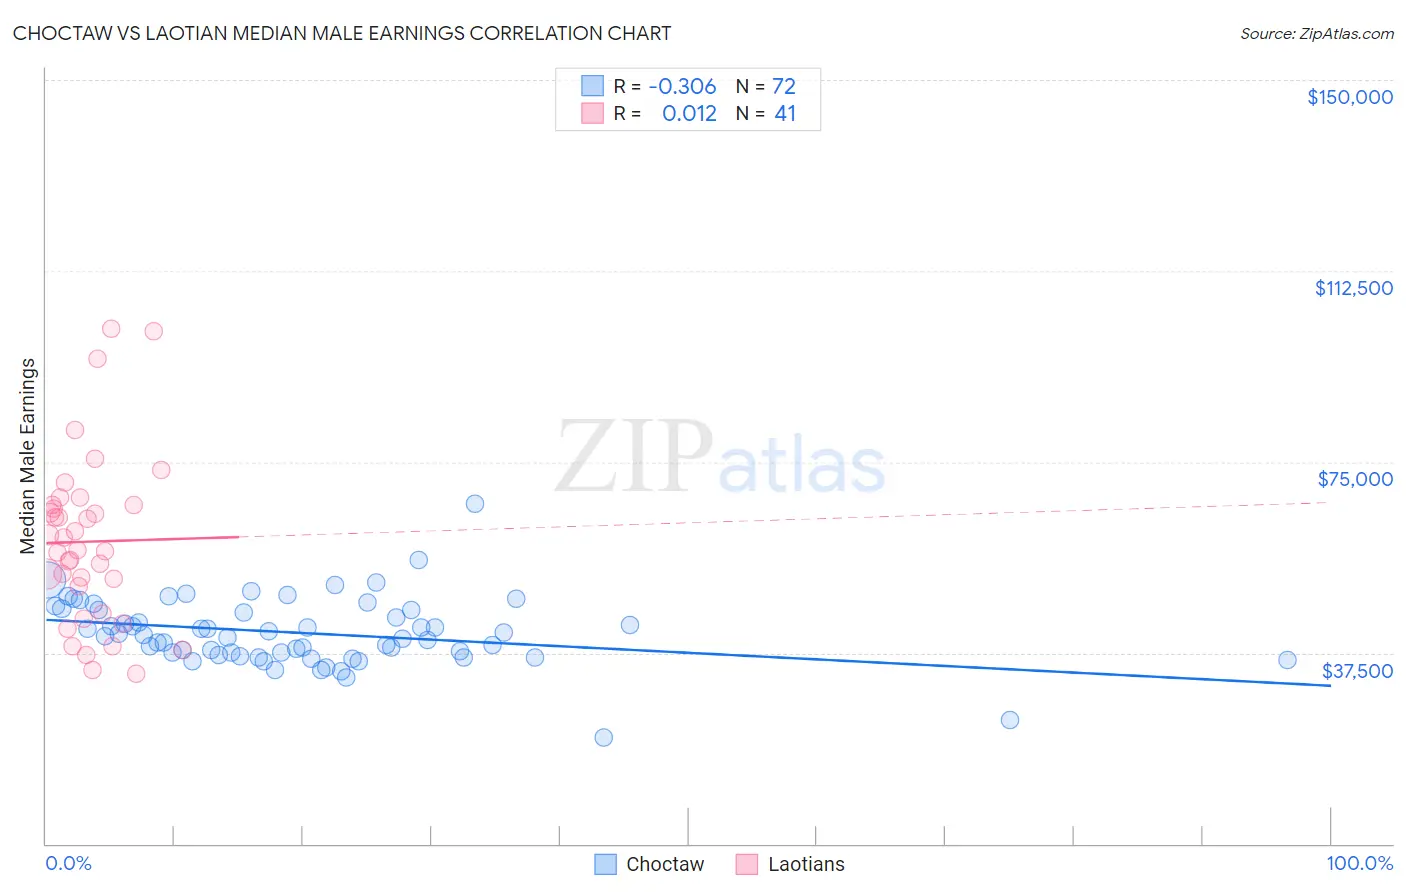
Choctaw vs Laotian Median Male Earnings Correlation Chart
The statistical analysis conducted on geographies consisting of 269,619,289 people shows a mild negative correlation between the proportion of Choctaw and median male earnings in the United States with a correlation coefficient (R) of -0.306 and weighted average of $47,729. Similarly, the statistical analysis conducted on geographies consisting of 224,845,741 people shows no correlation between the proportion of Laotians and median male earnings in the United States with a correlation coefficient (R) of 0.012 and weighted average of $59,351, a difference of 24.3%.
Median Male Earnings Correlation Summary
| Measurement | Choctaw | Laotian |
| Minimum | $20,833 | $33,481 |
| Maximum | $66,862 | $101,250 |
| Range | $46,029 | $67,769 |
| Mean | $41,431 | $59,314 |
| Median | $40,848 | $57,776 |
| Interquartile 25% (IQ1) | $37,230 | $47,781 |
| Interquartile 75% (IQ3) | $45,935 | $66,498 |
| Interquartile Range (IQR) | $8,705 | $18,717 |
| Standard Deviation (Sample) | $6,709 | $16,323 |
| Standard Deviation (Population) | $6,663 | $16,122 |
Similar Demographics by Median Male Earnings
Demographics Similar to Choctaw by Median Male Earnings
In terms of median male earnings, the demographic groups most similar to Choctaw are Immigrants from Dominica ($47,651, a difference of 0.16%), Immigrants from Belize ($47,809, a difference of 0.17%), Chickasaw ($47,832, a difference of 0.22%), Shoshone ($47,930, a difference of 0.42%), and Indonesian ($47,503, a difference of 0.48%).
| Demographics | Rating | Rank | Median Male Earnings |
| Africans | 0.2 /100 | #284 | Tragic $47,994 |
| Paiute | 0.2 /100 | #285 | Tragic $47,991 |
| Mexican American Indians | 0.2 /100 | #286 | Tragic $47,990 |
| Immigrants | El Salvador | 0.2 /100 | #287 | Tragic $47,973 |
| Shoshone | 0.2 /100 | #288 | Tragic $47,930 |
| Chickasaw | 0.1 /100 | #289 | Tragic $47,832 |
| Immigrants | Belize | 0.1 /100 | #290 | Tragic $47,809 |
| Choctaw | 0.1 /100 | #291 | Tragic $47,729 |
| Immigrants | Dominica | 0.1 /100 | #292 | Tragic $47,651 |
| Indonesians | 0.1 /100 | #293 | Tragic $47,503 |
| Immigrants | Nicaragua | 0.1 /100 | #294 | Tragic $47,482 |
| Central American Indians | 0.1 /100 | #295 | Tragic $47,433 |
| Inupiat | 0.1 /100 | #296 | Tragic $47,281 |
| Dominicans | 0.1 /100 | #297 | Tragic $47,204 |
| Immigrants | Micronesia | 0.1 /100 | #298 | Tragic $47,177 |
Demographics Similar to Laotians by Median Male Earnings
In terms of median male earnings, the demographic groups most similar to Laotians are Austrian ($59,359, a difference of 0.010%), Immigrants from Moldova ($59,417, a difference of 0.11%), Immigrants from Kazakhstan ($59,278, a difference of 0.12%), Immigrants from Southern Europe ($59,217, a difference of 0.23%), and Immigrants from Argentina ($59,491, a difference of 0.24%).
| Demographics | Rating | Rank | Median Male Earnings |
| Afghans | 99.3 /100 | #84 | Exceptional $59,554 |
| Italians | 99.3 /100 | #85 | Exceptional $59,551 |
| Immigrants | England | 99.3 /100 | #86 | Exceptional $59,527 |
| Macedonians | 99.3 /100 | #87 | Exceptional $59,522 |
| Immigrants | Argentina | 99.3 /100 | #88 | Exceptional $59,491 |
| Immigrants | Moldova | 99.2 /100 | #89 | Exceptional $59,417 |
| Austrians | 99.2 /100 | #90 | Exceptional $59,359 |
| Laotians | 99.2 /100 | #91 | Exceptional $59,351 |
| Immigrants | Kazakhstan | 99.1 /100 | #92 | Exceptional $59,278 |
| Immigrants | Southern Europe | 99.0 /100 | #93 | Exceptional $59,217 |
| Immigrants | North Macedonia | 99.0 /100 | #94 | Exceptional $59,189 |
| Immigrants | Lebanon | 98.6 /100 | #95 | Exceptional $58,835 |
| Albanians | 98.4 /100 | #96 | Exceptional $58,680 |
| Northern Europeans | 98.2 /100 | #97 | Exceptional $58,588 |
| Jordanians | 98.1 /100 | #98 | Exceptional $58,500 |