Syrian vs Laotian Median Male Earnings
COMPARE
Syrian
Laotian
Median Male Earnings
Median Male Earnings Comparison
Syrians
Laotians
$58,187
MEDIAN MALE EARNINGS
97.4/ 100
METRIC RATING
102nd/ 347
METRIC RANK
$59,351
MEDIAN MALE EARNINGS
99.2/ 100
METRIC RATING
91st/ 347
METRIC RANK
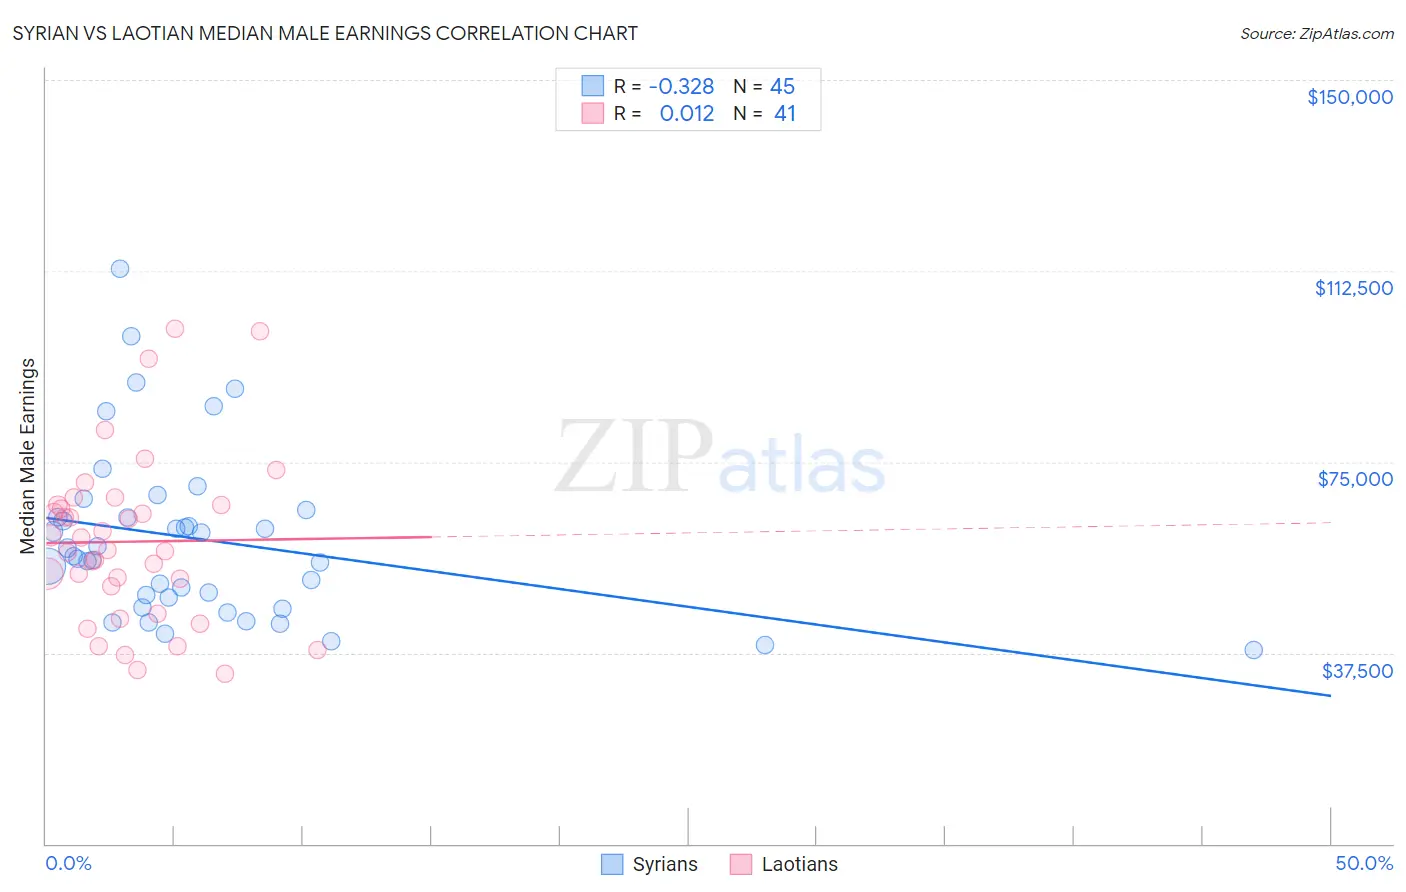
Syrian vs Laotian Median Male Earnings Correlation Chart
The statistical analysis conducted on geographies consisting of 266,273,099 people shows a mild negative correlation between the proportion of Syrians and median male earnings in the United States with a correlation coefficient (R) of -0.328 and weighted average of $58,187. Similarly, the statistical analysis conducted on geographies consisting of 224,845,741 people shows no correlation between the proportion of Laotians and median male earnings in the United States with a correlation coefficient (R) of 0.012 and weighted average of $59,351, a difference of 2.0%.
Median Male Earnings Correlation Summary
| Measurement | Syrian | Laotian |
| Minimum | $38,125 | $33,481 |
| Maximum | $112,858 | $101,250 |
| Range | $74,733 | $67,769 |
| Mean | $59,779 | $59,314 |
| Median | $56,452 | $57,776 |
| Interquartile 25% (IQ1) | $47,297 | $47,781 |
| Interquartile 75% (IQ3) | $64,910 | $66,498 |
| Interquartile Range (IQR) | $17,614 | $18,717 |
| Standard Deviation (Sample) | $16,573 | $16,323 |
| Standard Deviation (Population) | $16,388 | $16,122 |
Demographics Similar to Syrians and Laotians by Median Male Earnings
In terms of median male earnings, the demographic groups most similar to Syrians are Polish ($58,139, a difference of 0.080%), Armenian ($58,134, a difference of 0.090%), Immigrants from Western Asia ($58,131, a difference of 0.10%), Immigrants from Brazil ($58,324, a difference of 0.24%), and Immigrants from Northern Africa ($58,008, a difference of 0.31%). Similarly, the demographic groups most similar to Laotians are Austrian ($59,359, a difference of 0.010%), Immigrants from Moldova ($59,417, a difference of 0.11%), Immigrants from Kazakhstan ($59,278, a difference of 0.12%), Immigrants from Southern Europe ($59,217, a difference of 0.23%), and Immigrants from Argentina ($59,491, a difference of 0.24%).
| Demographics | Rating | Rank | Median Male Earnings |
| Immigrants | England | 99.3 /100 | #86 | Exceptional $59,527 |
| Macedonians | 99.3 /100 | #87 | Exceptional $59,522 |
| Immigrants | Argentina | 99.3 /100 | #88 | Exceptional $59,491 |
| Immigrants | Moldova | 99.2 /100 | #89 | Exceptional $59,417 |
| Austrians | 99.2 /100 | #90 | Exceptional $59,359 |
| Laotians | 99.2 /100 | #91 | Exceptional $59,351 |
| Immigrants | Kazakhstan | 99.1 /100 | #92 | Exceptional $59,278 |
| Immigrants | Southern Europe | 99.0 /100 | #93 | Exceptional $59,217 |
| Immigrants | North Macedonia | 99.0 /100 | #94 | Exceptional $59,189 |
| Immigrants | Lebanon | 98.6 /100 | #95 | Exceptional $58,835 |
| Albanians | 98.4 /100 | #96 | Exceptional $58,680 |
| Northern Europeans | 98.2 /100 | #97 | Exceptional $58,588 |
| Jordanians | 98.1 /100 | #98 | Exceptional $58,500 |
| Immigrants | Poland | 98.0 /100 | #99 | Exceptional $58,452 |
| Assyrians/Chaldeans/Syriacs | 97.9 /100 | #100 | Exceptional $58,437 |
| Immigrants | Brazil | 97.7 /100 | #101 | Exceptional $58,324 |
| Syrians | 97.4 /100 | #102 | Exceptional $58,187 |
| Poles | 97.3 /100 | #103 | Exceptional $58,139 |
| Armenians | 97.3 /100 | #104 | Exceptional $58,134 |
| Immigrants | Western Asia | 97.3 /100 | #105 | Exceptional $58,131 |
| Immigrants | Northern Africa | 96.9 /100 | #106 | Exceptional $58,008 |