Choctaw vs Comanche Median Household Income
COMPARE
Choctaw
Comanche
Median Household Income
Median Household Income Comparison
Choctaw
Comanche
$69,947
MEDIAN HOUSEHOLD INCOME
0.0/ 100
METRIC RATING
322nd/ 347
METRIC RANK
$73,747
MEDIAN HOUSEHOLD INCOME
0.1/ 100
METRIC RATING
292nd/ 347
METRIC RANK
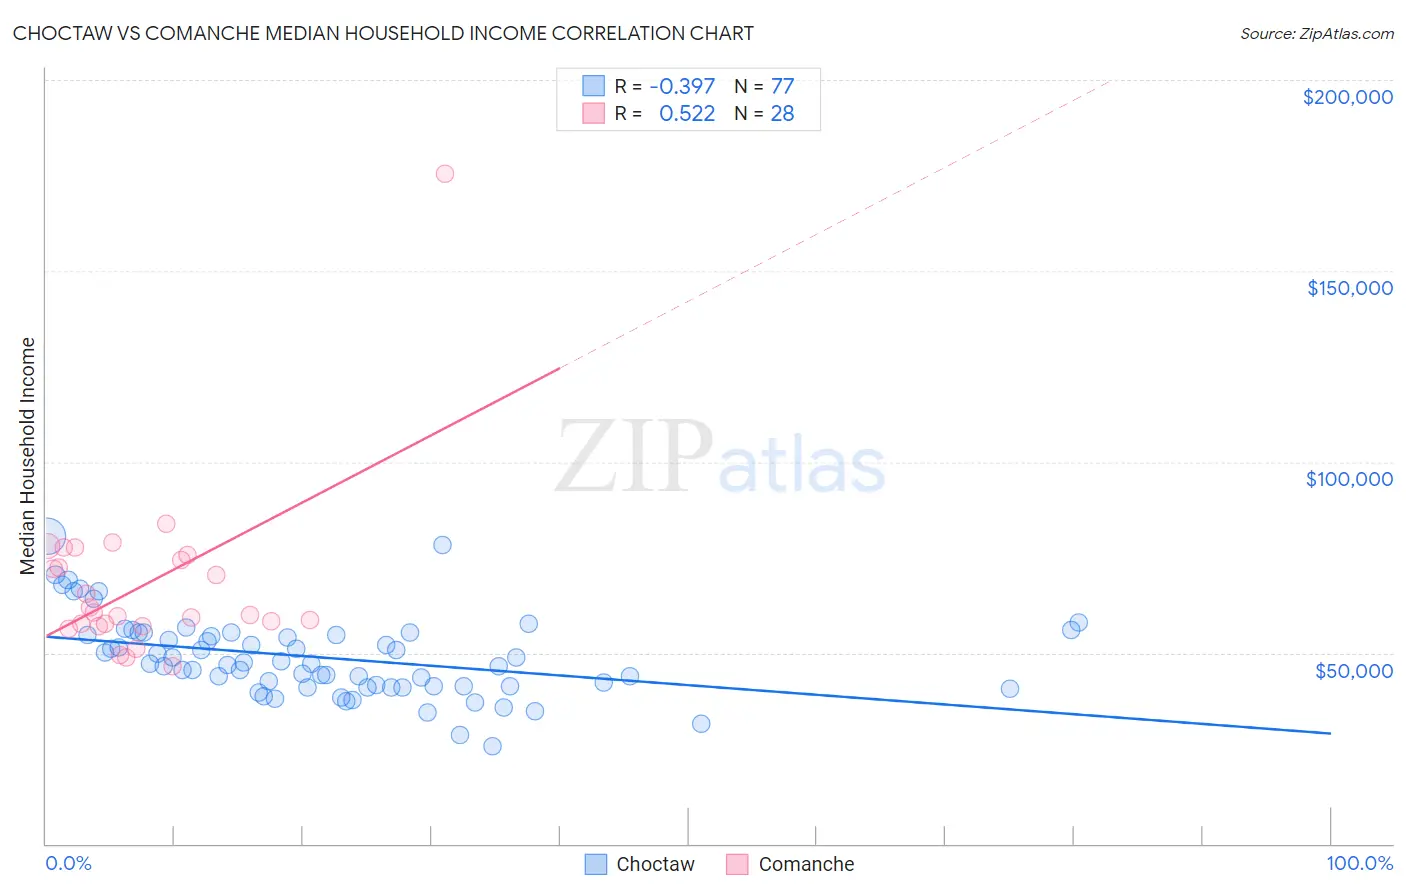
Choctaw vs Comanche Median Household Income Correlation Chart
The statistical analysis conducted on geographies consisting of 269,579,280 people shows a mild negative correlation between the proportion of Choctaw and median household income in the United States with a correlation coefficient (R) of -0.397 and weighted average of $69,947. Similarly, the statistical analysis conducted on geographies consisting of 109,755,043 people shows a substantial positive correlation between the proportion of Comanche and median household income in the United States with a correlation coefficient (R) of 0.522 and weighted average of $73,747, a difference of 5.4%.
Median Household Income Correlation Summary
| Measurement | Choctaw | Comanche |
| Minimum | $25,625 | $46,632 |
| Maximum | $80,457 | $175,595 |
| Range | $54,832 | $128,963 |
| Mean | $48,786 | $67,911 |
| Median | $47,101 | $60,223 |
| Interquartile 25% (IQ1) | $41,215 | $57,248 |
| Interquartile 75% (IQ3) | $54,919 | $74,998 |
| Interquartile Range (IQR) | $13,705 | $17,750 |
| Standard Deviation (Sample) | $10,591 | $23,505 |
| Standard Deviation (Population) | $10,522 | $23,081 |
Similar Demographics by Median Household Income
Demographics Similar to Choctaw by Median Household Income
In terms of median household income, the demographic groups most similar to Choctaw are Chickasaw ($70,005, a difference of 0.080%), Colville ($70,094, a difference of 0.21%), Bahamian ($69,726, a difference of 0.32%), Yup'ik ($69,695, a difference of 0.36%), and Immigrants from Dominican Republic ($70,208, a difference of 0.37%).
| Demographics | Rating | Rank | Median Household Income |
| Ottawa | 0.0 /100 | #315 | Tragic $70,984 |
| Apache | 0.0 /100 | #316 | Tragic $70,927 |
| Cajuns | 0.0 /100 | #317 | Tragic $70,605 |
| Chippewa | 0.0 /100 | #318 | Tragic $70,539 |
| Immigrants | Dominican Republic | 0.0 /100 | #319 | Tragic $70,208 |
| Colville | 0.0 /100 | #320 | Tragic $70,094 |
| Chickasaw | 0.0 /100 | #321 | Tragic $70,005 |
| Choctaw | 0.0 /100 | #322 | Tragic $69,947 |
| Bahamians | 0.0 /100 | #323 | Tragic $69,726 |
| Yup'ik | 0.0 /100 | #324 | Tragic $69,695 |
| Seminole | 0.0 /100 | #325 | Tragic $69,420 |
| Yuman | 0.0 /100 | #326 | Tragic $68,743 |
| Immigrants | Cuba | 0.0 /100 | #327 | Tragic $68,461 |
| Menominee | 0.0 /100 | #328 | Tragic $68,423 |
| Dutch West Indians | 0.0 /100 | #329 | Tragic $68,412 |
Demographics Similar to Comanche by Median Household Income
In terms of median household income, the demographic groups most similar to Comanche are Hispanic or Latino ($73,823, a difference of 0.10%), Immigrants from Cabo Verde ($73,515, a difference of 0.31%), Blackfeet ($73,509, a difference of 0.32%), Cuban ($73,392, a difference of 0.48%), and Bangladeshi ($74,112, a difference of 0.50%).
| Demographics | Rating | Rank | Median Household Income |
| Mexicans | 0.1 /100 | #285 | Tragic $74,399 |
| Immigrants | Somalia | 0.1 /100 | #286 | Tragic $74,300 |
| Iroquois | 0.1 /100 | #287 | Tragic $74,279 |
| Immigrants | Central America | 0.1 /100 | #288 | Tragic $74,217 |
| Fijians | 0.1 /100 | #289 | Tragic $74,205 |
| Bangladeshis | 0.1 /100 | #290 | Tragic $74,112 |
| Hispanics or Latinos | 0.1 /100 | #291 | Tragic $73,823 |
| Comanche | 0.1 /100 | #292 | Tragic $73,747 |
| Immigrants | Cabo Verde | 0.1 /100 | #293 | Tragic $73,515 |
| Blackfeet | 0.1 /100 | #294 | Tragic $73,509 |
| Cubans | 0.1 /100 | #295 | Tragic $73,392 |
| Haitians | 0.1 /100 | #296 | Tragic $73,306 |
| Immigrants | Mexico | 0.0 /100 | #297 | Tragic $73,160 |
| Paiute | 0.0 /100 | #298 | Tragic $72,959 |
| Indonesians | 0.0 /100 | #299 | Tragic $72,856 |