Chippewa vs Immigrants from Lebanon Median Household Income
COMPARE
Chippewa
Immigrants from Lebanon
Median Household Income
Median Household Income Comparison
Chippewa
Immigrants from Lebanon
$70,539
MEDIAN HOUSEHOLD INCOME
0.0/ 100
METRIC RATING
318th/ 347
METRIC RANK
$91,887
MEDIAN HOUSEHOLD INCOME
98.7/ 100
METRIC RATING
93rd/ 347
METRIC RANK
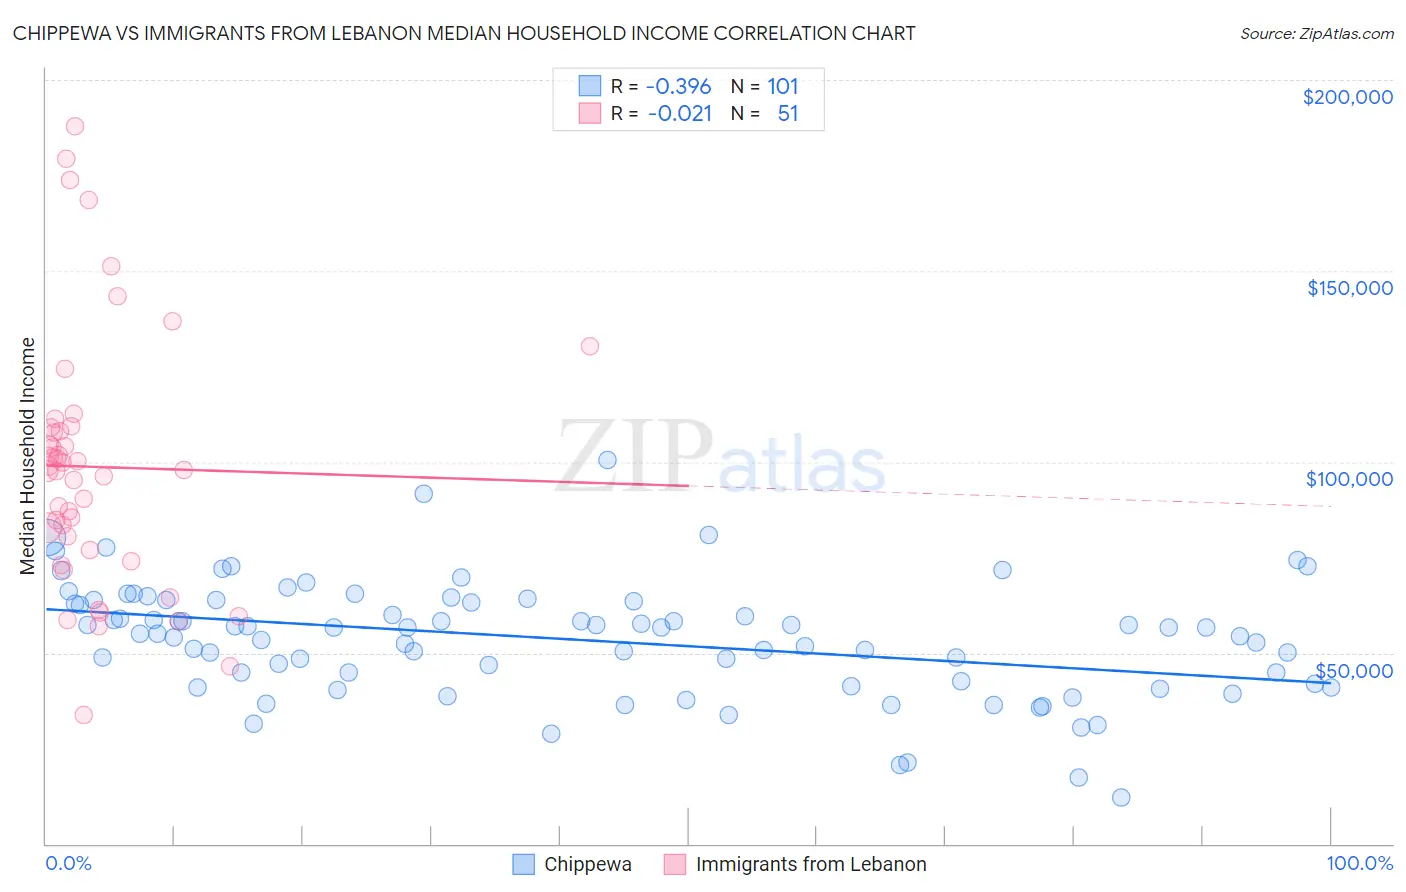
Chippewa vs Immigrants from Lebanon Median Household Income Correlation Chart
The statistical analysis conducted on geographies consisting of 214,988,479 people shows a mild negative correlation between the proportion of Chippewa and median household income in the United States with a correlation coefficient (R) of -0.396 and weighted average of $70,539. Similarly, the statistical analysis conducted on geographies consisting of 217,104,456 people shows no correlation between the proportion of Immigrants from Lebanon and median household income in the United States with a correlation coefficient (R) of -0.021 and weighted average of $91,887, a difference of 30.3%.
Median Household Income Correlation Summary
| Measurement | Chippewa | Immigrants from Lebanon |
| Minimum | $12,000 | $33,750 |
| Maximum | $100,625 | $187,750 |
| Range | $88,625 | $154,000 |
| Mean | $53,554 | $98,672 |
| Median | $56,473 | $97,787 |
| Interquartile 25% (IQ1) | $42,264 | $76,889 |
| Interquartile 75% (IQ3) | $63,716 | $108,907 |
| Interquartile Range (IQR) | $21,452 | $32,018 |
| Standard Deviation (Sample) | $15,182 | $33,219 |
| Standard Deviation (Population) | $15,107 | $32,891 |
Similar Demographics by Median Household Income
Demographics Similar to Chippewa by Median Household Income
In terms of median household income, the demographic groups most similar to Chippewa are Cajun ($70,605, a difference of 0.090%), Immigrants from Dominican Republic ($70,208, a difference of 0.47%), Apache ($70,927, a difference of 0.55%), Ottawa ($70,984, a difference of 0.63%), and Colville ($70,094, a difference of 0.63%).
| Demographics | Rating | Rank | Median Household Income |
| Immigrants | Zaire | 0.0 /100 | #311 | Tragic $71,801 |
| Immigrants | Honduras | 0.0 /100 | #312 | Tragic $71,452 |
| Immigrants | Bahamas | 0.0 /100 | #313 | Tragic $71,349 |
| Dominicans | 0.0 /100 | #314 | Tragic $71,302 |
| Ottawa | 0.0 /100 | #315 | Tragic $70,984 |
| Apache | 0.0 /100 | #316 | Tragic $70,927 |
| Cajuns | 0.0 /100 | #317 | Tragic $70,605 |
| Chippewa | 0.0 /100 | #318 | Tragic $70,539 |
| Immigrants | Dominican Republic | 0.0 /100 | #319 | Tragic $70,208 |
| Colville | 0.0 /100 | #320 | Tragic $70,094 |
| Chickasaw | 0.0 /100 | #321 | Tragic $70,005 |
| Choctaw | 0.0 /100 | #322 | Tragic $69,947 |
| Bahamians | 0.0 /100 | #323 | Tragic $69,726 |
| Yup'ik | 0.0 /100 | #324 | Tragic $69,695 |
| Seminole | 0.0 /100 | #325 | Tragic $69,420 |
Demographics Similar to Immigrants from Lebanon by Median Household Income
In terms of median household income, the demographic groups most similar to Immigrants from Lebanon are Immigrants from North America ($91,860, a difference of 0.030%), Immigrants from Western Europe ($91,936, a difference of 0.050%), Armenian ($91,807, a difference of 0.090%), Jordanian ($91,794, a difference of 0.10%), and Assyrian/Chaldean/Syriac ($91,991, a difference of 0.11%).
| Demographics | Rating | Rank | Median Household Income |
| Immigrants | England | 98.9 /100 | #86 | Exceptional $92,098 |
| Immigrants | Hungary | 98.9 /100 | #87 | Exceptional $92,094 |
| Immigrants | Canada | 98.8 /100 | #88 | Exceptional $92,029 |
| Romanians | 98.8 /100 | #89 | Exceptional $91,994 |
| Assyrians/Chaldeans/Syriacs | 98.8 /100 | #90 | Exceptional $91,991 |
| Immigrants | Vietnam | 98.8 /100 | #91 | Exceptional $91,987 |
| Immigrants | Western Europe | 98.8 /100 | #92 | Exceptional $91,936 |
| Immigrants | Lebanon | 98.7 /100 | #93 | Exceptional $91,887 |
| Immigrants | North America | 98.7 /100 | #94 | Exceptional $91,860 |
| Armenians | 98.7 /100 | #95 | Exceptional $91,807 |
| Jordanians | 98.7 /100 | #96 | Exceptional $91,794 |
| Immigrants | Serbia | 98.6 /100 | #97 | Exceptional $91,730 |
| Immigrants | Southern Europe | 98.5 /100 | #98 | Exceptional $91,605 |
| Immigrants | South Eastern Asia | 98.4 /100 | #99 | Exceptional $91,541 |
| Ukrainians | 98.3 /100 | #100 | Exceptional $91,456 |