Cajun vs Subsaharan African Median Household Income
COMPARE
Cajun
Subsaharan African
Median Household Income
Median Household Income Comparison
Cajuns
Sub-Saharan Africans
$70,605
MEDIAN HOUSEHOLD INCOME
0.0/ 100
METRIC RATING
317th/ 347
METRIC RANK
$77,631
MEDIAN HOUSEHOLD INCOME
0.8/ 100
METRIC RATING
254th/ 347
METRIC RANK
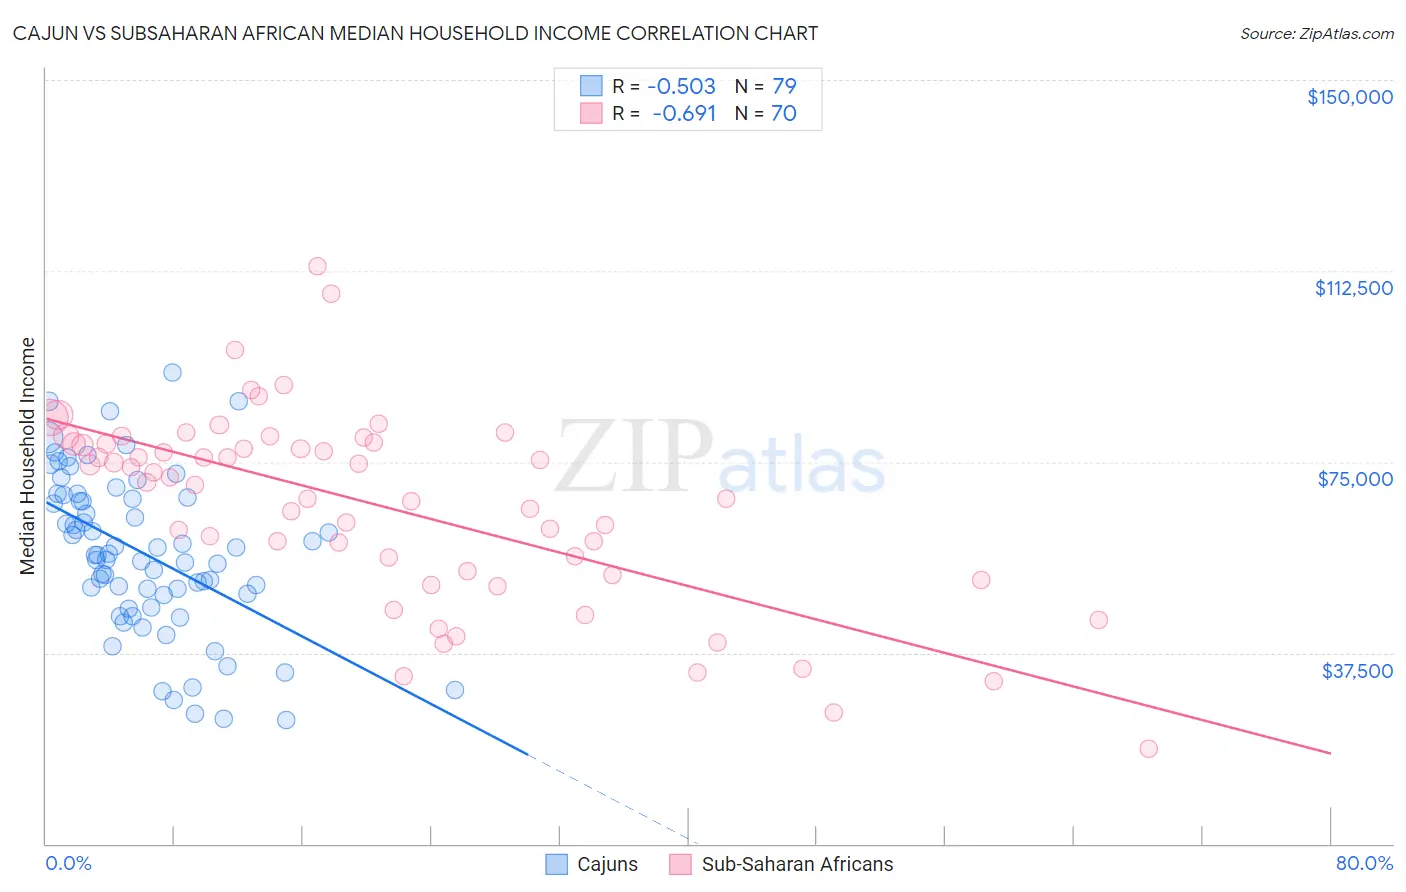
Cajun vs Subsaharan African Median Household Income Correlation Chart
The statistical analysis conducted on geographies consisting of 149,670,755 people shows a substantial negative correlation between the proportion of Cajuns and median household income in the United States with a correlation coefficient (R) of -0.503 and weighted average of $70,605. Similarly, the statistical analysis conducted on geographies consisting of 507,380,534 people shows a significant negative correlation between the proportion of Sub-Saharan Africans and median household income in the United States with a correlation coefficient (R) of -0.691 and weighted average of $77,631, a difference of 10.0%.
Median Household Income Correlation Summary
| Measurement | Cajun | Subsaharan African |
| Minimum | $24,375 | $18,750 |
| Maximum | $92,480 | $113,418 |
| Range | $68,105 | $94,668 |
| Mean | $57,001 | $66,483 |
| Median | $56,809 | $71,386 |
| Interquartile 25% (IQ1) | $48,865 | $53,589 |
| Interquartile 75% (IQ3) | $68,083 | $78,576 |
| Interquartile Range (IQR) | $19,218 | $24,988 |
| Standard Deviation (Sample) | $15,446 | $18,848 |
| Standard Deviation (Population) | $15,348 | $18,713 |
Similar Demographics by Median Household Income
Demographics Similar to Cajuns by Median Household Income
In terms of median household income, the demographic groups most similar to Cajuns are Chippewa ($70,539, a difference of 0.090%), Apache ($70,927, a difference of 0.46%), Ottawa ($70,984, a difference of 0.54%), Immigrants from Dominican Republic ($70,208, a difference of 0.56%), and Colville ($70,094, a difference of 0.73%).
| Demographics | Rating | Rank | Median Household Income |
| U.S. Virgin Islanders | 0.0 /100 | #310 | Tragic $71,853 |
| Immigrants | Zaire | 0.0 /100 | #311 | Tragic $71,801 |
| Immigrants | Honduras | 0.0 /100 | #312 | Tragic $71,452 |
| Immigrants | Bahamas | 0.0 /100 | #313 | Tragic $71,349 |
| Dominicans | 0.0 /100 | #314 | Tragic $71,302 |
| Ottawa | 0.0 /100 | #315 | Tragic $70,984 |
| Apache | 0.0 /100 | #316 | Tragic $70,927 |
| Cajuns | 0.0 /100 | #317 | Tragic $70,605 |
| Chippewa | 0.0 /100 | #318 | Tragic $70,539 |
| Immigrants | Dominican Republic | 0.0 /100 | #319 | Tragic $70,208 |
| Colville | 0.0 /100 | #320 | Tragic $70,094 |
| Chickasaw | 0.0 /100 | #321 | Tragic $70,005 |
| Choctaw | 0.0 /100 | #322 | Tragic $69,947 |
| Bahamians | 0.0 /100 | #323 | Tragic $69,726 |
| Yup'ik | 0.0 /100 | #324 | Tragic $69,695 |
Demographics Similar to Sub-Saharan Africans by Median Household Income
In terms of median household income, the demographic groups most similar to Sub-Saharan Africans are Immigrants from St. Vincent and the Grenadines ($77,690, a difference of 0.080%), Immigrants from Middle Africa ($77,559, a difference of 0.090%), Immigrants from West Indies ($77,956, a difference of 0.42%), Mexican American Indian ($78,166, a difference of 0.69%), and Belizean ($77,028, a difference of 0.78%).
| Demographics | Rating | Rank | Median Household Income |
| Immigrants | Burma/Myanmar | 1.6 /100 | #247 | Tragic $78,682 |
| Sudanese | 1.5 /100 | #248 | Tragic $78,529 |
| West Indians | 1.4 /100 | #249 | Tragic $78,455 |
| Immigrants | Laos | 1.3 /100 | #250 | Tragic $78,327 |
| Mexican American Indians | 1.2 /100 | #251 | Tragic $78,166 |
| Immigrants | West Indies | 1.0 /100 | #252 | Tragic $77,956 |
| Immigrants | St. Vincent and the Grenadines | 0.9 /100 | #253 | Tragic $77,690 |
| Sub-Saharan Africans | 0.8 /100 | #254 | Tragic $77,631 |
| Immigrants | Middle Africa | 0.8 /100 | #255 | Tragic $77,559 |
| Belizeans | 0.6 /100 | #256 | Tragic $77,028 |
| Immigrants | Senegal | 0.5 /100 | #257 | Tragic $76,915 |
| Immigrants | Nicaragua | 0.5 /100 | #258 | Tragic $76,784 |
| Spanish American Indians | 0.4 /100 | #259 | Tragic $76,670 |
| Jamaicans | 0.4 /100 | #260 | Tragic $76,583 |
| Immigrants | Grenada | 0.4 /100 | #261 | Tragic $76,517 |