Cajun vs Cypriot Median Household Income
COMPARE
Cajun
Cypriot
Median Household Income
Median Household Income Comparison
Cajuns
Cypriots
$70,605
MEDIAN HOUSEHOLD INCOME
0.0/ 100
METRIC RATING
317th/ 347
METRIC RANK
$102,843
MEDIAN HOUSEHOLD INCOME
100.0/ 100
METRIC RATING
18th/ 347
METRIC RANK
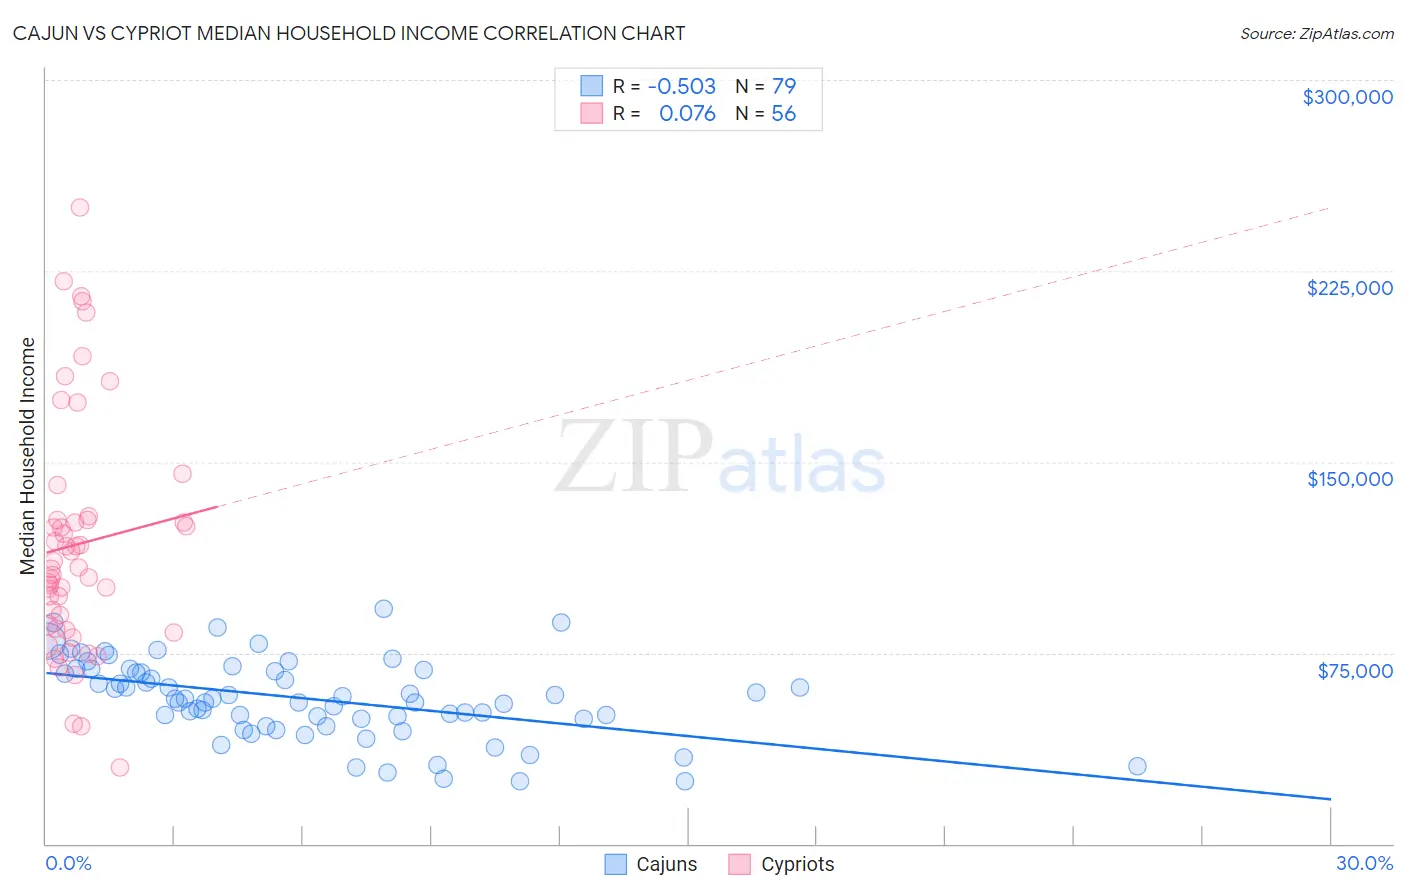
Cajun vs Cypriot Median Household Income Correlation Chart
The statistical analysis conducted on geographies consisting of 149,670,755 people shows a substantial negative correlation between the proportion of Cajuns and median household income in the United States with a correlation coefficient (R) of -0.503 and weighted average of $70,605. Similarly, the statistical analysis conducted on geographies consisting of 61,845,026 people shows a slight positive correlation between the proportion of Cypriots and median household income in the United States with a correlation coefficient (R) of 0.076 and weighted average of $102,843, a difference of 45.7%.
Median Household Income Correlation Summary
| Measurement | Cajun | Cypriot |
| Minimum | $24,375 | $30,029 |
| Maximum | $92,480 | $250,001 |
| Range | $68,105 | $219,972 |
| Mean | $57,001 | $117,612 |
| Median | $56,809 | $108,270 |
| Interquartile 25% (IQ1) | $48,865 | $84,969 |
| Interquartile 75% (IQ3) | $68,083 | $127,095 |
| Interquartile Range (IQR) | $19,218 | $42,126 |
| Standard Deviation (Sample) | $15,446 | $46,602 |
| Standard Deviation (Population) | $15,348 | $46,184 |
Similar Demographics by Median Household Income
Demographics Similar to Cajuns by Median Household Income
In terms of median household income, the demographic groups most similar to Cajuns are Chippewa ($70,539, a difference of 0.090%), Apache ($70,927, a difference of 0.46%), Ottawa ($70,984, a difference of 0.54%), Immigrants from Dominican Republic ($70,208, a difference of 0.56%), and Colville ($70,094, a difference of 0.73%).
| Demographics | Rating | Rank | Median Household Income |
| U.S. Virgin Islanders | 0.0 /100 | #310 | Tragic $71,853 |
| Immigrants | Zaire | 0.0 /100 | #311 | Tragic $71,801 |
| Immigrants | Honduras | 0.0 /100 | #312 | Tragic $71,452 |
| Immigrants | Bahamas | 0.0 /100 | #313 | Tragic $71,349 |
| Dominicans | 0.0 /100 | #314 | Tragic $71,302 |
| Ottawa | 0.0 /100 | #315 | Tragic $70,984 |
| Apache | 0.0 /100 | #316 | Tragic $70,927 |
| Cajuns | 0.0 /100 | #317 | Tragic $70,605 |
| Chippewa | 0.0 /100 | #318 | Tragic $70,539 |
| Immigrants | Dominican Republic | 0.0 /100 | #319 | Tragic $70,208 |
| Colville | 0.0 /100 | #320 | Tragic $70,094 |
| Chickasaw | 0.0 /100 | #321 | Tragic $70,005 |
| Choctaw | 0.0 /100 | #322 | Tragic $69,947 |
| Bahamians | 0.0 /100 | #323 | Tragic $69,726 |
| Yup'ik | 0.0 /100 | #324 | Tragic $69,695 |
Demographics Similar to Cypriots by Median Household Income
In terms of median household income, the demographic groups most similar to Cypriots are Immigrants from Korea ($102,962, a difference of 0.12%), Immigrants from Australia ($102,562, a difference of 0.27%), Burmese ($103,145, a difference of 0.29%), Bolivian ($102,195, a difference of 0.63%), and Eastern European ($101,781, a difference of 1.0%).
| Demographics | Rating | Rank | Median Household Income |
| Immigrants | China | 100.0 /100 | #11 | Exceptional $105,335 |
| Indians (Asian) | 100.0 /100 | #12 | Exceptional $105,262 |
| Immigrants | Eastern Asia | 100.0 /100 | #13 | Exceptional $104,796 |
| Immigrants | Ireland | 100.0 /100 | #14 | Exceptional $104,692 |
| Immigrants | Israel | 100.0 /100 | #15 | Exceptional $104,090 |
| Burmese | 100.0 /100 | #16 | Exceptional $103,145 |
| Immigrants | Korea | 100.0 /100 | #17 | Exceptional $102,962 |
| Cypriots | 100.0 /100 | #18 | Exceptional $102,843 |
| Immigrants | Australia | 100.0 /100 | #19 | Exceptional $102,562 |
| Bolivians | 100.0 /100 | #20 | Exceptional $102,195 |
| Eastern Europeans | 100.0 /100 | #21 | Exceptional $101,781 |
| Asians | 100.0 /100 | #22 | Exceptional $101,681 |
| Immigrants | Bolivia | 100.0 /100 | #23 | Exceptional $101,394 |
| Immigrants | Japan | 100.0 /100 | #24 | Exceptional $100,711 |
| Immigrants | Sweden | 100.0 /100 | #25 | Exceptional $100,699 |