Spaniard vs Cypriot Median Household Income
COMPARE
Spaniard
Cypriot
Median Household Income
Median Household Income Comparison
Spaniards
Cypriots
$84,644
MEDIAN HOUSEHOLD INCOME
42.7/ 100
METRIC RATING
183rd/ 347
METRIC RANK
$102,843
MEDIAN HOUSEHOLD INCOME
100.0/ 100
METRIC RATING
18th/ 347
METRIC RANK
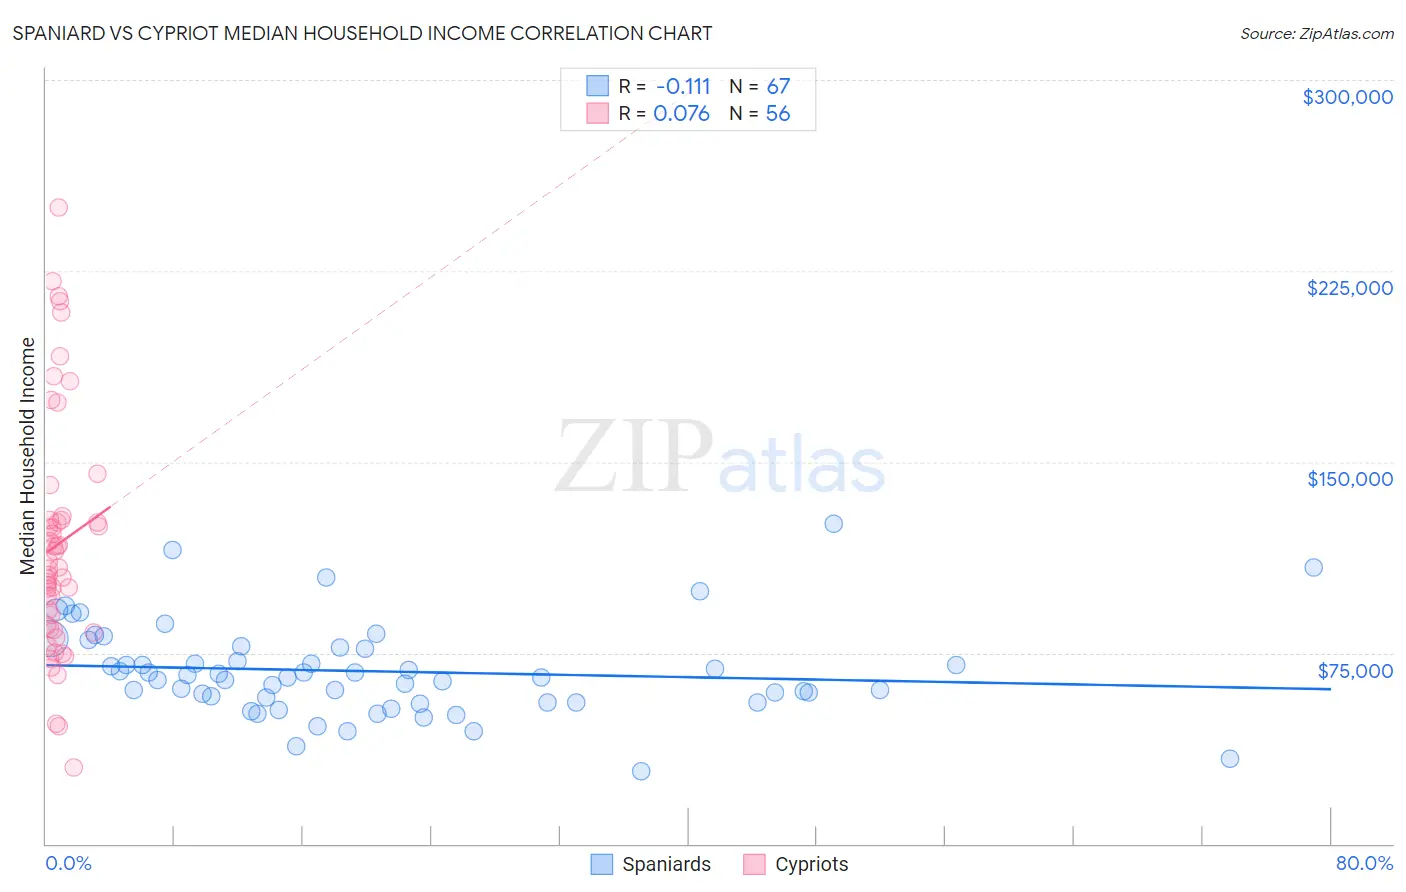
Spaniard vs Cypriot Median Household Income Correlation Chart
The statistical analysis conducted on geographies consisting of 443,014,990 people shows a poor negative correlation between the proportion of Spaniards and median household income in the United States with a correlation coefficient (R) of -0.111 and weighted average of $84,644. Similarly, the statistical analysis conducted on geographies consisting of 61,845,026 people shows a slight positive correlation between the proportion of Cypriots and median household income in the United States with a correlation coefficient (R) of 0.076 and weighted average of $102,843, a difference of 21.5%.
Median Household Income Correlation Summary
| Measurement | Spaniard | Cypriot |
| Minimum | $28,571 | $30,029 |
| Maximum | $125,625 | $250,001 |
| Range | $97,054 | $219,972 |
| Mean | $67,731 | $117,612 |
| Median | $65,475 | $108,270 |
| Interquartile 25% (IQ1) | $55,726 | $84,969 |
| Interquartile 75% (IQ3) | $77,042 | $127,095 |
| Interquartile Range (IQR) | $21,316 | $42,126 |
| Standard Deviation (Sample) | $18,232 | $46,602 |
| Standard Deviation (Population) | $18,096 | $46,184 |
Similar Demographics by Median Household Income
Demographics Similar to Spaniards by Median Household Income
In terms of median household income, the demographic groups most similar to Spaniards are Uruguayan ($84,691, a difference of 0.060%), Hawaiian ($84,729, a difference of 0.10%), Immigrants from Portugal ($84,740, a difference of 0.11%), English ($84,915, a difference of 0.32%), and Czechoslovakian ($84,965, a difference of 0.38%).
| Demographics | Rating | Rank | Median Household Income |
| Alsatians | 49.2 /100 | #176 | Average $85,053 |
| Immigrants | Eritrea | 48.8 /100 | #177 | Average $85,025 |
| Czechoslovakians | 47.8 /100 | #178 | Average $84,965 |
| English | 47.0 /100 | #179 | Average $84,915 |
| Immigrants | Portugal | 44.2 /100 | #180 | Average $84,740 |
| Hawaiians | 44.1 /100 | #181 | Average $84,729 |
| Uruguayans | 43.5 /100 | #182 | Average $84,691 |
| Spaniards | 42.7 /100 | #183 | Average $84,644 |
| Immigrants | Eastern Africa | 37.4 /100 | #184 | Fair $84,299 |
| Kenyans | 34.2 /100 | #185 | Fair $84,085 |
| Puget Sound Salish | 33.2 /100 | #186 | Fair $84,011 |
| Belgians | 33.2 /100 | #187 | Fair $84,008 |
| Tlingit-Haida | 32.6 /100 | #188 | Fair $83,968 |
| Immigrants | Colombia | 31.7 /100 | #189 | Fair $83,902 |
| Slovaks | 30.2 /100 | #190 | Fair $83,798 |
Demographics Similar to Cypriots by Median Household Income
In terms of median household income, the demographic groups most similar to Cypriots are Immigrants from Korea ($102,962, a difference of 0.12%), Immigrants from Australia ($102,562, a difference of 0.27%), Burmese ($103,145, a difference of 0.29%), Bolivian ($102,195, a difference of 0.63%), and Eastern European ($101,781, a difference of 1.0%).
| Demographics | Rating | Rank | Median Household Income |
| Immigrants | China | 100.0 /100 | #11 | Exceptional $105,335 |
| Indians (Asian) | 100.0 /100 | #12 | Exceptional $105,262 |
| Immigrants | Eastern Asia | 100.0 /100 | #13 | Exceptional $104,796 |
| Immigrants | Ireland | 100.0 /100 | #14 | Exceptional $104,692 |
| Immigrants | Israel | 100.0 /100 | #15 | Exceptional $104,090 |
| Burmese | 100.0 /100 | #16 | Exceptional $103,145 |
| Immigrants | Korea | 100.0 /100 | #17 | Exceptional $102,962 |
| Cypriots | 100.0 /100 | #18 | Exceptional $102,843 |
| Immigrants | Australia | 100.0 /100 | #19 | Exceptional $102,562 |
| Bolivians | 100.0 /100 | #20 | Exceptional $102,195 |
| Eastern Europeans | 100.0 /100 | #21 | Exceptional $101,781 |
| Asians | 100.0 /100 | #22 | Exceptional $101,681 |
| Immigrants | Bolivia | 100.0 /100 | #23 | Exceptional $101,394 |
| Immigrants | Japan | 100.0 /100 | #24 | Exceptional $100,711 |
| Immigrants | Sweden | 100.0 /100 | #25 | Exceptional $100,699 |