Immigrants from Honduras vs Central American Median Male Earnings
COMPARE
Immigrants from Honduras
Central American
Median Male Earnings
Median Male Earnings Comparison
Immigrants from Honduras
Central Americans
$45,787
MEDIAN MALE EARNINGS
0.0/ 100
METRIC RATING
320th/ 347
METRIC RANK
$48,093
MEDIAN MALE EARNINGS
0.2/ 100
METRIC RATING
282nd/ 347
METRIC RANK
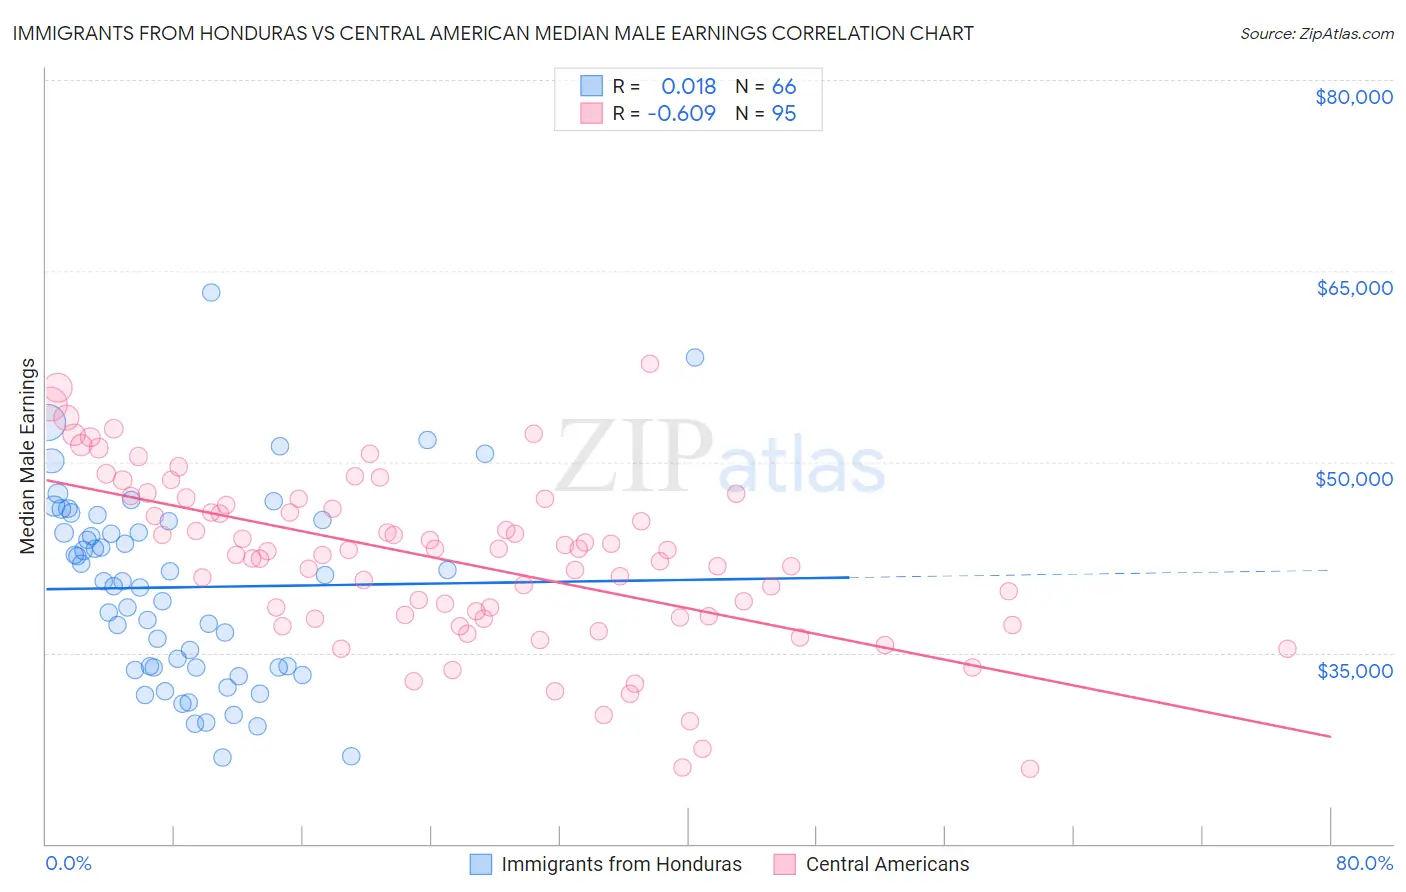
Immigrants from Honduras vs Central American Median Male Earnings Correlation Chart
The statistical analysis conducted on geographies consisting of 322,554,949 people shows no correlation between the proportion of Immigrants from Honduras and median male earnings in the United States with a correlation coefficient (R) of 0.018 and weighted average of $45,787. Similarly, the statistical analysis conducted on geographies consisting of 504,312,553 people shows a significant negative correlation between the proportion of Central Americans and median male earnings in the United States with a correlation coefficient (R) of -0.609 and weighted average of $48,093, a difference of 5.0%.
Median Male Earnings Correlation Summary
| Measurement | Immigrants from Honduras | Central American |
| Minimum | $26,786 | $25,893 |
| Maximum | $63,286 | $57,715 |
| Range | $36,500 | $31,822 |
| Mean | $40,153 | $42,312 |
| Median | $40,629 | $42,955 |
| Interquartile 25% (IQ1) | $33,830 | $37,781 |
| Interquartile 75% (IQ3) | $45,376 | $47,084 |
| Interquartile Range (IQR) | $11,546 | $9,303 |
| Standard Deviation (Sample) | $7,556 | $6,615 |
| Standard Deviation (Population) | $7,498 | $6,580 |
Similar Demographics by Median Male Earnings
Demographics Similar to Immigrants from Honduras by Median Male Earnings
In terms of median male earnings, the demographic groups most similar to Immigrants from Honduras are Haitian ($45,903, a difference of 0.25%), Fijian ($45,607, a difference of 0.39%), Sioux ($45,566, a difference of 0.48%), Immigrants from Central America ($45,538, a difference of 0.55%), and Black/African American ($45,523, a difference of 0.58%).
| Demographics | Rating | Rank | Median Male Earnings |
| Hondurans | 0.0 /100 | #313 | Tragic $46,374 |
| Chippewa | 0.0 /100 | #314 | Tragic $46,368 |
| Immigrants | Guatemala | 0.0 /100 | #315 | Tragic $46,244 |
| Immigrants | Caribbean | 0.0 /100 | #316 | Tragic $46,193 |
| Mexicans | 0.0 /100 | #317 | Tragic $46,147 |
| Cheyenne | 0.0 /100 | #318 | Tragic $46,062 |
| Haitians | 0.0 /100 | #319 | Tragic $45,903 |
| Immigrants | Honduras | 0.0 /100 | #320 | Tragic $45,787 |
| Fijians | 0.0 /100 | #321 | Tragic $45,607 |
| Sioux | 0.0 /100 | #322 | Tragic $45,566 |
| Immigrants | Central America | 0.0 /100 | #323 | Tragic $45,538 |
| Blacks/African Americans | 0.0 /100 | #324 | Tragic $45,523 |
| Yuman | 0.0 /100 | #325 | Tragic $45,446 |
| Immigrants | Haiti | 0.0 /100 | #326 | Tragic $45,266 |
| Immigrants | Bahamas | 0.0 /100 | #327 | Tragic $45,176 |
Demographics Similar to Central Americans by Median Male Earnings
In terms of median male earnings, the demographic groups most similar to Central Americans are Marshallese ($48,137, a difference of 0.090%), Immigrants from Jamaica ($48,040, a difference of 0.11%), African ($47,994, a difference of 0.21%), Paiute ($47,991, a difference of 0.21%), and Mexican American Indian ($47,990, a difference of 0.22%).
| Demographics | Rating | Rank | Median Male Earnings |
| Immigrants | Somalia | 0.3 /100 | #275 | Tragic $48,439 |
| Blackfeet | 0.3 /100 | #276 | Tragic $48,402 |
| Belizeans | 0.2 /100 | #277 | Tragic $48,358 |
| Immigrants | Liberia | 0.2 /100 | #278 | Tragic $48,317 |
| Hmong | 0.2 /100 | #279 | Tragic $48,254 |
| Comanche | 0.2 /100 | #280 | Tragic $48,202 |
| Marshallese | 0.2 /100 | #281 | Tragic $48,137 |
| Central Americans | 0.2 /100 | #282 | Tragic $48,093 |
| Immigrants | Jamaica | 0.2 /100 | #283 | Tragic $48,040 |
| Africans | 0.2 /100 | #284 | Tragic $47,994 |
| Paiute | 0.2 /100 | #285 | Tragic $47,991 |
| Mexican American Indians | 0.2 /100 | #286 | Tragic $47,990 |
| Immigrants | El Salvador | 0.2 /100 | #287 | Tragic $47,973 |
| Shoshone | 0.2 /100 | #288 | Tragic $47,930 |
| Chickasaw | 0.1 /100 | #289 | Tragic $47,832 |