British West Indian vs Iroquois Median Male Earnings
COMPARE
British West Indian
Iroquois
Median Male Earnings
Median Male Earnings Comparison
British West Indians
Iroquois
$49,636
MEDIAN MALE EARNINGS
0.8/ 100
METRIC RATING
257th/ 347
METRIC RANK
$49,374
MEDIAN MALE EARNINGS
0.7/ 100
METRIC RATING
260th/ 347
METRIC RANK
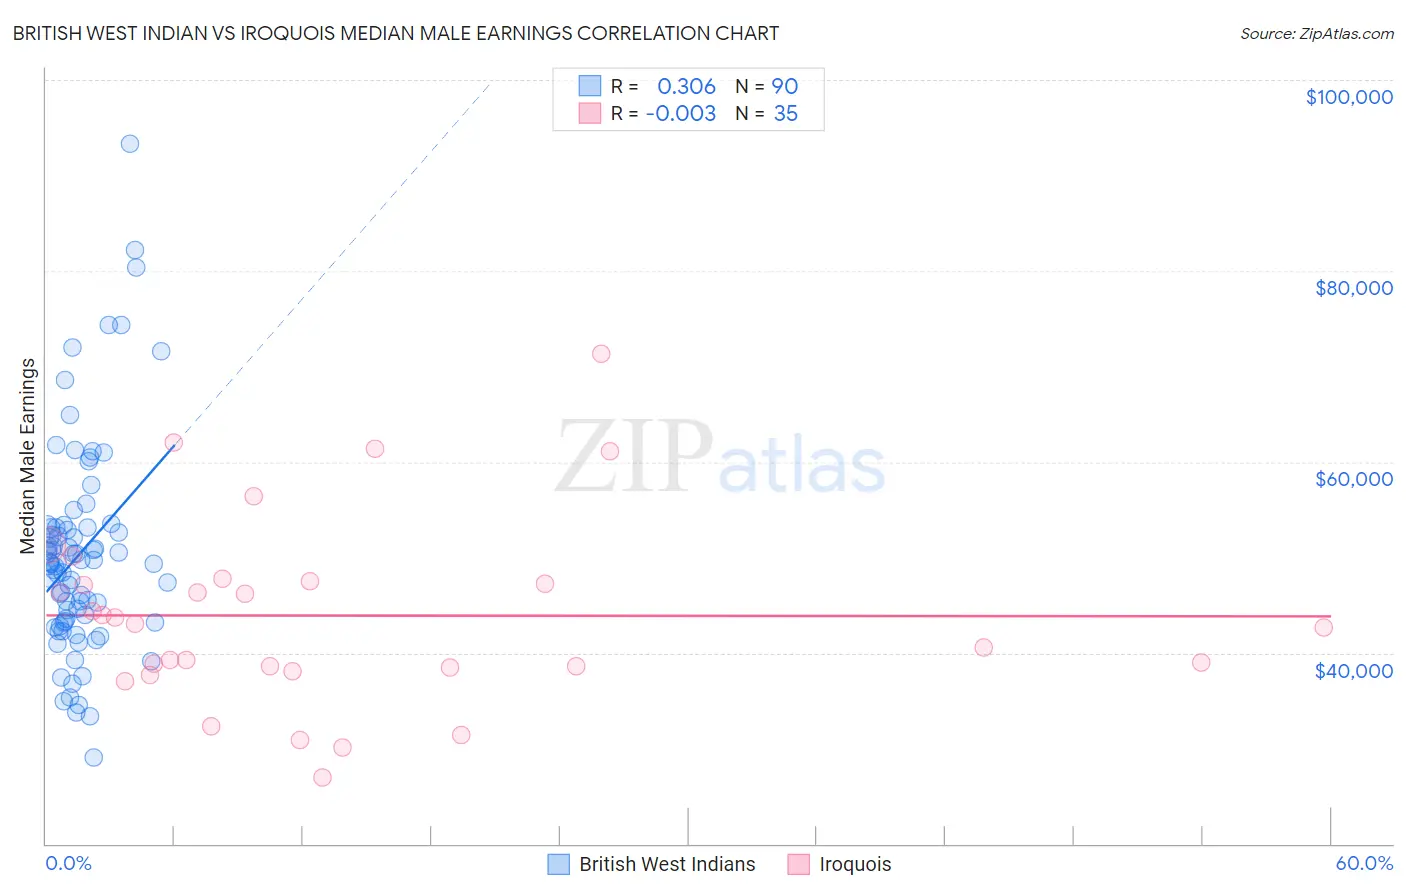
British West Indian vs Iroquois Median Male Earnings Correlation Chart
The statistical analysis conducted on geographies consisting of 152,683,188 people shows a mild positive correlation between the proportion of British West Indians and median male earnings in the United States with a correlation coefficient (R) of 0.306 and weighted average of $49,636. Similarly, the statistical analysis conducted on geographies consisting of 207,261,653 people shows no correlation between the proportion of Iroquois and median male earnings in the United States with a correlation coefficient (R) of -0.003 and weighted average of $49,374, a difference of 0.53%.
Median Male Earnings Correlation Summary
| Measurement | British West Indian | Iroquois |
| Minimum | $28,979 | $26,985 |
| Maximum | $93,333 | $71,281 |
| Range | $64,354 | $44,296 |
| Mean | $50,358 | $43,903 |
| Median | $49,413 | $43,033 |
| Interquartile 25% (IQ1) | $43,337 | $38,514 |
| Interquartile 75% (IQ3) | $53,079 | $47,481 |
| Interquartile Range (IQR) | $9,742 | $8,967 |
| Standard Deviation (Sample) | $11,060 | $9,773 |
| Standard Deviation (Population) | $10,999 | $9,632 |
Demographics Similar to British West Indians and Iroquois by Median Male Earnings
In terms of median male earnings, the demographic groups most similar to British West Indians are Alaska Native ($49,711, a difference of 0.15%), Alaskan Athabascan ($49,748, a difference of 0.23%), Senegalese ($49,774, a difference of 0.28%), Cree ($49,497, a difference of 0.28%), and Nepalese ($49,458, a difference of 0.36%). Similarly, the demographic groups most similar to Iroquois are Liberian ($49,318, a difference of 0.11%), Nepalese ($49,458, a difference of 0.17%), Immigrants from West Indies ($49,271, a difference of 0.21%), Cree ($49,497, a difference of 0.25%), and Nicaraguan ($49,215, a difference of 0.32%).
| Demographics | Rating | Rank | Median Male Earnings |
| Immigrants | Guyana | 1.6 /100 | #248 | Tragic $50,321 |
| Immigrants | Burma/Myanmar | 1.6 /100 | #249 | Tragic $50,298 |
| Osage | 1.6 /100 | #250 | Tragic $50,292 |
| Immigrants | Grenada | 1.6 /100 | #251 | Tragic $50,279 |
| Immigrants | Cabo Verde | 1.2 /100 | #252 | Tragic $50,009 |
| German Russians | 1.1 /100 | #253 | Tragic $49,924 |
| Senegalese | 1.0 /100 | #254 | Tragic $49,774 |
| Alaskan Athabascans | 0.9 /100 | #255 | Tragic $49,748 |
| Alaska Natives | 0.9 /100 | #256 | Tragic $49,711 |
| British West Indians | 0.8 /100 | #257 | Tragic $49,636 |
| Cree | 0.7 /100 | #258 | Tragic $49,497 |
| Nepalese | 0.7 /100 | #259 | Tragic $49,458 |
| Iroquois | 0.7 /100 | #260 | Tragic $49,374 |
| Liberians | 0.6 /100 | #261 | Tragic $49,318 |
| Immigrants | West Indies | 0.6 /100 | #262 | Tragic $49,271 |
| Nicaraguans | 0.6 /100 | #263 | Tragic $49,215 |
| Immigrants | Middle Africa | 0.6 /100 | #264 | Tragic $49,201 |
| Immigrants | Laos | 0.6 /100 | #265 | Tragic $49,190 |
| Somalis | 0.5 /100 | #266 | Tragic $49,025 |
| Spanish Americans | 0.5 /100 | #267 | Tragic $49,008 |
| Ute | 0.4 /100 | #268 | Tragic $48,899 |