Bhutanese vs Immigrants from Argentina Median Family Income
COMPARE
Bhutanese
Immigrants from Argentina
Median Family Income
Median Family Income Comparison
Bhutanese
Immigrants from Argentina
$119,800
MEDIAN FAMILY INCOME
100.0/ 100
METRIC RATING
33rd/ 347
METRIC RANK
$110,873
MEDIAN FAMILY INCOME
98.5/ 100
METRIC RATING
89th/ 347
METRIC RANK
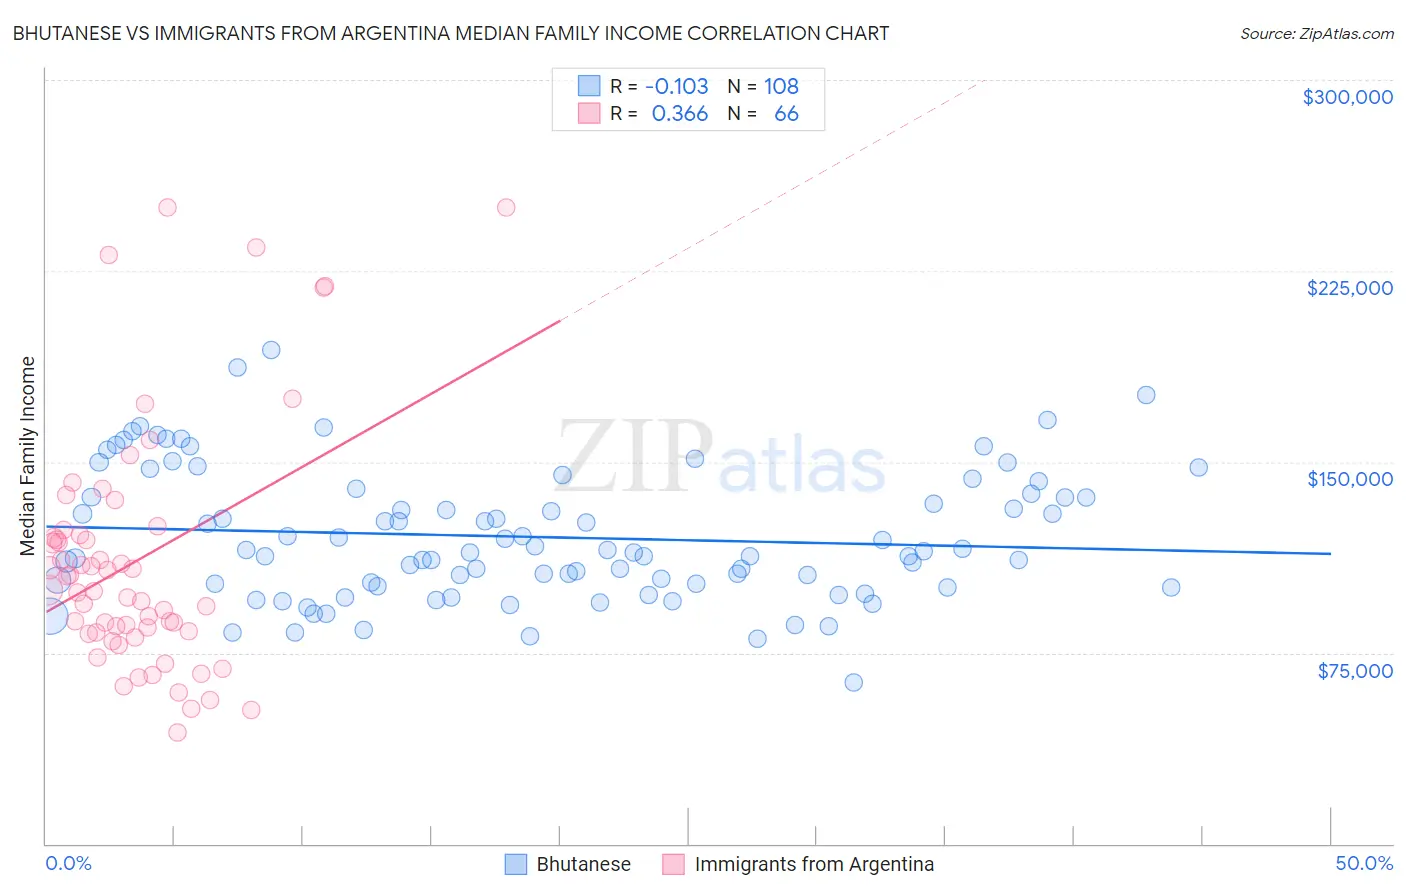
Bhutanese vs Immigrants from Argentina Median Family Income Correlation Chart
The statistical analysis conducted on geographies consisting of 454,953,353 people shows a poor negative correlation between the proportion of Bhutanese and median family income in the United States with a correlation coefficient (R) of -0.103 and weighted average of $119,800. Similarly, the statistical analysis conducted on geographies consisting of 264,326,105 people shows a mild positive correlation between the proportion of Immigrants from Argentina and median family income in the United States with a correlation coefficient (R) of 0.366 and weighted average of $110,873, a difference of 8.1%.
Median Family Income Correlation Summary
| Measurement | Bhutanese | Immigrants from Argentina |
| Minimum | $63,382 | $43,750 |
| Maximum | $194,165 | $250,001 |
| Range | $130,783 | $206,251 |
| Mean | $120,532 | $111,446 |
| Median | $114,614 | $99,402 |
| Interquartile 25% (IQ1) | $101,662 | $83,128 |
| Interquartile 75% (IQ3) | $136,845 | $121,234 |
| Interquartile Range (IQR) | $35,183 | $38,106 |
| Standard Deviation (Sample) | $25,704 | $47,916 |
| Standard Deviation (Population) | $25,585 | $47,552 |
Similar Demographics by Median Family Income
Demographics Similar to Bhutanese by Median Family Income
In terms of median family income, the demographic groups most similar to Bhutanese are Asian ($119,955, a difference of 0.13%), Immigrants from France ($120,076, a difference of 0.23%), Bolivian ($119,479, a difference of 0.27%), Immigrants from Sri Lanka ($120,263, a difference of 0.39%), and Latvian ($120,301, a difference of 0.42%).
| Demographics | Rating | Rank | Median Family Income |
| Immigrants | Switzerland | 100.0 /100 | #26 | Exceptional $120,726 |
| Russians | 100.0 /100 | #27 | Exceptional $120,487 |
| Immigrants | Denmark | 100.0 /100 | #28 | Exceptional $120,445 |
| Latvians | 100.0 /100 | #29 | Exceptional $120,301 |
| Immigrants | Sri Lanka | 100.0 /100 | #30 | Exceptional $120,263 |
| Immigrants | France | 100.0 /100 | #31 | Exceptional $120,076 |
| Asians | 100.0 /100 | #32 | Exceptional $119,955 |
| Bhutanese | 100.0 /100 | #33 | Exceptional $119,800 |
| Bolivians | 100.0 /100 | #34 | Exceptional $119,479 |
| Soviet Union | 100.0 /100 | #35 | Exceptional $119,262 |
| Israelis | 100.0 /100 | #36 | Exceptional $118,577 |
| Australians | 100.0 /100 | #37 | Exceptional $118,440 |
| Immigrants | Turkey | 100.0 /100 | #38 | Exceptional $118,325 |
| Immigrants | Asia | 100.0 /100 | #39 | Exceptional $118,291 |
| Immigrants | Lithuania | 100.0 /100 | #40 | Exceptional $118,053 |
Demographics Similar to Immigrants from Argentina by Median Family Income
In terms of median family income, the demographic groups most similar to Immigrants from Argentina are Northern European ($110,635, a difference of 0.21%), Immigrants from Southern Europe ($110,614, a difference of 0.23%), Romanian ($111,243, a difference of 0.33%), Austrian ($111,306, a difference of 0.39%), and Croatian ($111,370, a difference of 0.45%).
| Demographics | Rating | Rank | Median Family Income |
| Immigrants | England | 99.2 /100 | #82 | Exceptional $112,038 |
| Immigrants | Egypt | 99.0 /100 | #83 | Exceptional $111,689 |
| Immigrants | Hungary | 98.8 /100 | #84 | Exceptional $111,378 |
| Croatians | 98.8 /100 | #85 | Exceptional $111,370 |
| Ukrainians | 98.8 /100 | #86 | Exceptional $111,368 |
| Austrians | 98.8 /100 | #87 | Exceptional $111,306 |
| Romanians | 98.8 /100 | #88 | Exceptional $111,243 |
| Immigrants | Argentina | 98.5 /100 | #89 | Exceptional $110,873 |
| Northern Europeans | 98.3 /100 | #90 | Exceptional $110,635 |
| Immigrants | Southern Europe | 98.3 /100 | #91 | Exceptional $110,614 |
| Immigrants | Lebanon | 97.9 /100 | #92 | Exceptional $110,159 |
| Immigrants | Kazakhstan | 97.8 /100 | #93 | Exceptional $110,137 |
| Koreans | 97.8 /100 | #94 | Exceptional $110,103 |
| Zimbabweans | 97.7 /100 | #95 | Exceptional $110,011 |
| Immigrants | Moldova | 97.7 /100 | #96 | Exceptional $109,975 |