Basque vs Chickasaw Median Family Income
COMPARE
Basque
Chickasaw
Median Family Income
Median Family Income Comparison
Basques
Chickasaw
$104,760
MEDIAN FAMILY INCOME
74.4/ 100
METRIC RATING
156th/ 347
METRIC RANK
$85,356
MEDIAN FAMILY INCOME
0.0/ 100
METRIC RATING
307th/ 347
METRIC RANK
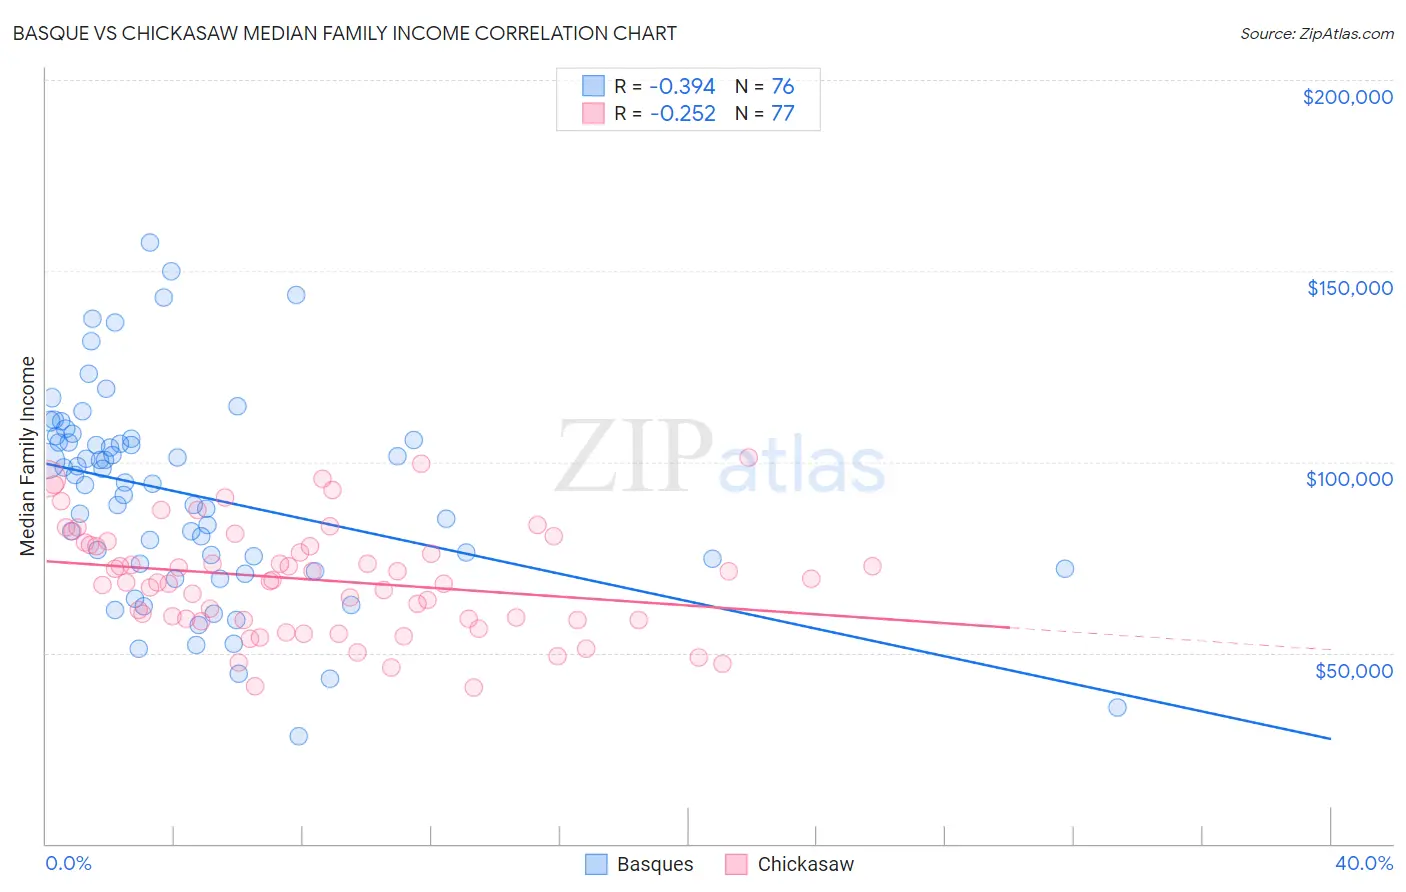
Basque vs Chickasaw Median Family Income Correlation Chart
The statistical analysis conducted on geographies consisting of 165,742,125 people shows a mild negative correlation between the proportion of Basques and median family income in the United States with a correlation coefficient (R) of -0.394 and weighted average of $104,760. Similarly, the statistical analysis conducted on geographies consisting of 147,660,168 people shows a weak negative correlation between the proportion of Chickasaw and median family income in the United States with a correlation coefficient (R) of -0.252 and weighted average of $85,356, a difference of 22.7%.
Median Family Income Correlation Summary
| Measurement | Basque | Chickasaw |
| Minimum | $28,036 | $40,774 |
| Maximum | $157,351 | $101,302 |
| Range | $129,315 | $60,528 |
| Mean | $91,256 | $69,119 |
| Median | $94,457 | $68,772 |
| Interquartile 25% (IQ1) | $72,725 | $58,750 |
| Interquartile 75% (IQ3) | $105,919 | $78,533 |
| Interquartile Range (IQR) | $33,194 | $19,783 |
| Standard Deviation (Sample) | $26,783 | $14,096 |
| Standard Deviation (Population) | $26,606 | $14,004 |
Similar Demographics by Median Family Income
Demographics Similar to Basques by Median Family Income
In terms of median family income, the demographic groups most similar to Basques are Native Hawaiian ($104,910, a difference of 0.14%), Immigrants from Nepal ($104,966, a difference of 0.20%), Moroccan ($104,488, a difference of 0.26%), Scandinavian ($104,410, a difference of 0.34%), and Swiss ($104,396, a difference of 0.35%).
| Demographics | Rating | Rank | Median Family Income |
| Immigrants | Germany | 80.9 /100 | #149 | Excellent $105,507 |
| Irish | 80.5 /100 | #150 | Excellent $105,453 |
| Peruvians | 80.4 /100 | #151 | Excellent $105,444 |
| Immigrants | Albania | 79.1 /100 | #152 | Good $105,285 |
| Slavs | 77.9 /100 | #153 | Good $105,144 |
| Immigrants | Nepal | 76.3 /100 | #154 | Good $104,966 |
| Native Hawaiians | 75.8 /100 | #155 | Good $104,910 |
| Basques | 74.4 /100 | #156 | Good $104,760 |
| Moroccans | 71.6 /100 | #157 | Good $104,488 |
| Scandinavians | 70.8 /100 | #158 | Good $104,410 |
| Swiss | 70.7 /100 | #159 | Good $104,396 |
| Scottish | 69.5 /100 | #160 | Good $104,288 |
| Icelanders | 69.4 /100 | #161 | Good $104,282 |
| Immigrants | Sierra Leone | 66.2 /100 | #162 | Good $103,990 |
| Costa Ricans | 66.2 /100 | #163 | Good $103,989 |
Demographics Similar to Chickasaw by Median Family Income
In terms of median family income, the demographic groups most similar to Chickasaw are Immigrants from Dominica ($85,411, a difference of 0.060%), Paiute ($85,414, a difference of 0.070%), U.S. Virgin Islander ($85,294, a difference of 0.070%), Haitian ($85,218, a difference of 0.16%), and Mexican ($85,618, a difference of 0.31%).
| Demographics | Rating | Rank | Median Family Income |
| Ottawa | 0.0 /100 | #300 | Tragic $86,380 |
| Colville | 0.0 /100 | #301 | Tragic $85,792 |
| Spanish American Indians | 0.0 /100 | #302 | Tragic $85,728 |
| Hispanics or Latinos | 0.0 /100 | #303 | Tragic $85,647 |
| Mexicans | 0.0 /100 | #304 | Tragic $85,618 |
| Paiute | 0.0 /100 | #305 | Tragic $85,414 |
| Immigrants | Dominica | 0.0 /100 | #306 | Tragic $85,411 |
| Chickasaw | 0.0 /100 | #307 | Tragic $85,356 |
| U.S. Virgin Islanders | 0.0 /100 | #308 | Tragic $85,294 |
| Haitians | 0.0 /100 | #309 | Tragic $85,218 |
| Immigrants | Central America | 0.0 /100 | #310 | Tragic $85,050 |
| Hondurans | 0.0 /100 | #311 | Tragic $85,004 |
| Cubans | 0.0 /100 | #312 | Tragic $84,981 |
| Choctaw | 0.0 /100 | #313 | Tragic $84,835 |
| Immigrants | Bahamas | 0.0 /100 | #314 | Tragic $84,732 |