Bangladeshi vs Nepalese Householder Income Under 25 years

COMPARE

Bangladeshi
Race
Ancestry
AfghanAfricanAlaska NativeAlaskan AthabascanAlbanianAleutAlsatianAmericanApacheArabArapahoArgentineanArmenianAssyrian/Chaldean/SyriacAustralianAustrianBahamianBangladeshiBarbadianBasqueBelgianBelizeanBermudanBhutaneseBlackfeetBolivianBrazilianBritishBritish West IndianBulgarianBurmeseCajunCambodianCanadianCape VerdeanCarpatho RusynCelticCentral AmericanCentral American IndianCherokeeCheyenneChickasawChileanChineseChippewaChoctawColombianColvilleComancheCosta RicanCreeCreekCroatianCrowCubanCypriotCzechCzechoslovakianDanishDelawareDominicanDutchDutch West IndianEastern EuropeanEcuadorianEgyptianEnglishEstonianEthiopianEuropeanFijianFilipinoFinnishFrenchFrench American IndianFrench CanadianGermanGerman RussianGhanaianGreekGuamanian/ChamorroGuatemalanGuyaneseHaitianHmongHonduranHopiHoumaHungarianIcelanderIndian (Asian)IndonesianInupiatIranianIraqiIrishIroquoisIsraeliItalianJamaicanJapaneseJordanianKenyanKiowaKoreanLaotianLatvianLebaneseLiberianLithuanianLumbeeLuxembourgerMacedonianMalaysianMalteseMarshalleseMenomineeMexicanMexican American IndianMongolianMoroccanNative HawaiianNavajoNew ZealanderNicaraguanNigerianNorthern EuropeanNorwegianOkinawanOsageOttawaPaiutePakistaniPalestinianPanamanianParaguayanPennsylvania GermanPeruvianPimaPolishPortuguesePotawatomiPuebloPuerto RicanPuget Sound SalishRomanianRussianSalvadoranSamoanScandinavianScotch-IrishScottishSeminoleSenegaleseSerbianShoshoneSierra LeoneanSiouxSlavicSlovakSloveneSomaliSouth AfricanSouth AmericanSouth American IndianSoviet UnionSpaniardSpanishSpanish AmericanSpanish American IndianSri LankanSubsaharan AfricanSudaneseSwedishSwissSyrianTaiwaneseThaiTlingit-HaidaTohono O'OdhamTonganTrinidadian and TobagonianTsimshianTurkishU.S. Virgin IslanderUgandanUkrainianUruguayanUteVenezuelanVietnameseWelshWest IndianYakamaYaquiYugoslavianYumanYup'ikZimbabwean
Immigration
NonimmigrantsImmigrantsAfghanistanAfricaAlbaniaArgentinaArmeniaAsiaAustraliaAustriaBahamasBangladeshBarbadosBelarusBelgiumBelizeBoliviaBosnia and HerzegovinaBrazilBulgariaBurma/MyanmarCabo VerdeCambodiaCameroonCanadaCaribbeanCentral AmericaChileChinaColombiaCongoCosta RicaCroatiaCubaCzechoslovakiaDenmarkDominicaDominican RepublicEastern AfricaEastern AsiaEastern EuropeEcuadorEgyptEl SalvadorEnglandEritreaEthiopiaEuropeFijiFranceGermanyGhanaGreeceGrenadaGuatemalaGuyanaHaitiHondurasHong KongHungaryIndiaIndonesiaIranIraqIrelandIsraelItalyJamaicaJapanJordanKazakhstanKenyaKoreaKuwaitLaosLatin AmericaLatviaLebanonLiberiaLithuaniaMalaysiaMexicoMicronesiaMiddle AfricaMoldovaMoroccoNepalNetherlandsNicaraguaNigeriaNorth AmericaNorth MacedoniaNorthern AfricaNorthern EuropeNorwayOceaniaPakistanPanamaPeruPhilippinesPolandPortugalRomaniaRussiaSaudi ArabiaScotlandSenegalSerbiaSierra LeoneSingaporeSomaliaSouth AfricaSouth AmericaSouth Central AsiaSouth Eastern AsiaSouthern EuropeSpainSri LankaSt. Vincent and the GrenadinesSudanSwedenSwitzerlandSyriaTaiwanThailandTrinidad and TobagoTurkeyUgandaUkraineUruguayUzbekistanVenezuelaVietnamWest IndiesWestern AfricaWestern AsiaWestern EuropeYemenZaireZimbabweAzores
Nepalese
Race
Ancestry
AfghanAfricanAlaska NativeAlaskan AthabascanAlbanianAleutAlsatianAmericanApacheArabArapahoArgentineanArmenianAssyrian/Chaldean/SyriacAustralianAustrianBahamianBarbadianBasqueBelgianBelizeanBermudanBhutaneseBlackfeetBolivianBrazilianBritishBritish West IndianBulgarianBurmeseCajunCambodianCanadianCape VerdeanCarpatho RusynCelticCentral AmericanCentral American IndianCherokeeCheyenneChickasawChileanChineseChippewaChoctawColombianColvilleComancheCosta RicanCreeCreekCroatianCrowCubanCypriotCzechCzechoslovakianDanishDelawareDominicanDutchDutch West IndianEastern EuropeanEcuadorianEgyptianEnglishEstonianEthiopianEuropeanFijianFilipinoFinnishFrenchFrench American IndianFrench CanadianGermanGerman RussianGhanaianGreekGuamanian/ChamorroGuatemalanGuyaneseHaitianHmongHonduranHopiHoumaHungarianIcelanderIndian (Asian)IndonesianInupiatIranianIraqiIrishIroquoisIsraeliItalianJamaicanJapaneseJordanianKenyanKiowaKoreanLaotianLatvianLebaneseLiberianLithuanianLumbeeLuxembourgerMacedonianMalaysianMalteseMarshalleseMenomineeMexicanMexican American IndianMongolianMoroccanNative HawaiianNavajoNepaleseNew ZealanderNicaraguanNigerianNorthern EuropeanNorwegianOkinawanOsageOttawaPaiutePakistaniPalestinianPanamanianParaguayanPennsylvania GermanPeruvianPimaPolishPortuguesePotawatomiPuebloPuerto RicanPuget Sound SalishRomanianRussianSalvadoranSamoanScandinavianScotch-IrishScottishSeminoleSenegaleseSerbianShoshoneSierra LeoneanSiouxSlavicSlovakSloveneSomaliSouth AfricanSouth AmericanSouth American IndianSoviet UnionSpaniardSpanishSpanish AmericanSpanish American IndianSri LankanSubsaharan AfricanSudaneseSwedishSwissSyrianTaiwaneseThaiTlingit-HaidaTohono O'OdhamTonganTrinidadian and TobagonianTsimshianTurkishU.S. Virgin IslanderUgandanUkrainianUruguayanUteVenezuelanVietnameseWelshWest IndianYakamaYaquiYugoslavianYumanYup'ikZimbabwean
Immigration
NonimmigrantsImmigrantsAfghanistanAfricaAlbaniaArgentinaArmeniaAsiaAustraliaAustriaBahamasBangladeshBarbadosBelarusBelgiumBelizeBoliviaBosnia and HerzegovinaBrazilBulgariaBurma/MyanmarCabo VerdeCambodiaCameroonCanadaCaribbeanCentral AmericaChileChinaColombiaCongoCosta RicaCroatiaCubaCzechoslovakiaDenmarkDominicaDominican RepublicEastern AfricaEastern AsiaEastern EuropeEcuadorEgyptEl SalvadorEnglandEritreaEthiopiaEuropeFijiFranceGermanyGhanaGreeceGrenadaGuatemalaGuyanaHaitiHondurasHong KongHungaryIndiaIndonesiaIranIraqIrelandIsraelItalyJamaicaJapanJordanKazakhstanKenyaKoreaKuwaitLaosLatin AmericaLatviaLebanonLiberiaLithuaniaMalaysiaMexicoMicronesiaMiddle AfricaMoldovaMoroccoNepalNetherlandsNicaraguaNigeriaNorth AmericaNorth MacedoniaNorthern AfricaNorthern EuropeNorwayOceaniaPakistanPanamaPeruPhilippinesPolandPortugalRomaniaRussiaSaudi ArabiaScotlandSenegalSerbiaSierra LeoneSingaporeSomaliaSouth AfricaSouth AmericaSouth Central AsiaSouth Eastern AsiaSouthern EuropeSpainSri LankaSt. Vincent and the GrenadinesSudanSwedenSwitzerlandSyriaTaiwanThailandTrinidad and TobagoTurkeyUgandaUkraineUruguayUzbekistanVenezuelaVietnamWest IndiesWestern AfricaWestern AsiaWestern EuropeYemenZaireZimbabweAzores
Householder Income Under 25 years
Income
Poverty
Unemployment
Labor Participation
Family Structure
Vehicle Availability
Education Level
Disability

Householder Income Under 25 years Comparison

Bangladeshis

Nepalese

Tragic
Exceptional
$47,589
HOUSEHOLDER INCOME UNDER 25 YEARS
0.0/ 100
METRIC RATING
307th/ 347
METRIC RANK
$54,472
HOUSEHOLDER INCOME UNDER 25 YEARS
99.6/ 100
METRIC RATING
78th/ 347
METRIC RANK

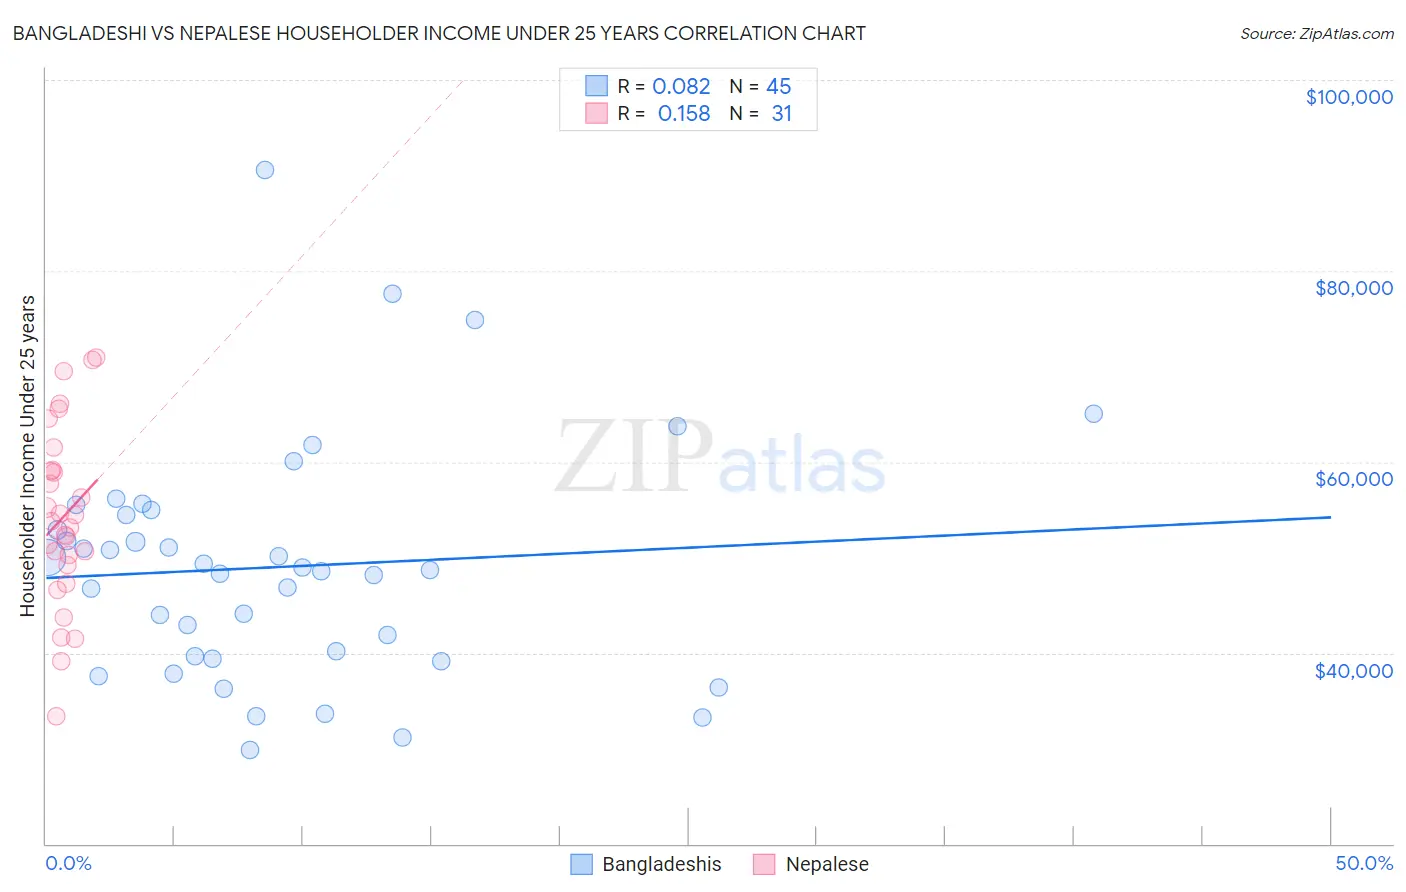
Bangladeshi vs Nepalese Householder Income Under 25 years Correlation Chart

The statistical analysis conducted on geographies consisting of 131,389,647 people shows a slight positive correlation between the proportion of Bangladeshis and household income with householder under the age of 25 in the United States with a correlation coefficient (R) of 0.082 and weighted average of $47,589. Similarly, the statistical analysis conducted on geographies consisting of 22,881,746 people shows a poor positive correlation between the proportion of Nepalese and household income with householder under the age of 25 in the United States with a correlation coefficient (R) of 0.158 and weighted average of $54,472, a difference of 14.5%.
Bangladeshi vs Nepalese Householder Income Under 25 years

Householder Income Under 25 years Correlation Summary

MeasurementBangladeshiNepalese
Minimum$29,883$33,325
Maximum$90,583$70,914
Range$60,700$37,589
Mean$49,001$54,229
Median$48,654$53,846
Interquartile 25% (IQ1)$39,531$49,219
Interquartile 75% (IQ3)$54,671$59,177
Interquartile Range (IQR)$15,140$9,958
Standard Deviation (Sample)$12,360$9,280
Standard Deviation (Population)$12,222$9,129

Similar Demographics by Householder Income Under 25 years

Demographics Similar to Bangladeshis by Householder Income Under 25 years

In terms of householder income under 25 years, the demographic groups most similar to Bangladeshis are Comanche ($47,518, a difference of 0.15%), Native/Alaskan ($47,704, a difference of 0.24%), U.S. Virgin Islander ($47,448, a difference of 0.30%), Iroquois ($47,380, a difference of 0.44%), and Ottawa ($47,366, a difference of 0.47%).
DemographicsRating | RankHouseholder Income Under 25 years
Immigrants | Somalia
0.0
/100
|
#300
Tragic
$48,135
Immigrants | Kuwait
0.0
/100
|
#301
Tragic
$48,126
Immigrants | Liberia
0.0
/100
|
#302
Tragic
$47,981
Immigrants | Middle Africa
0.0
/100
|
#303
Tragic
$47,916
Menominee
0.0
/100
|
#304
Tragic
$47,907
Cherokee
0.0
/100
|
#305
Tragic
$47,848
Natives/Alaskans
0.0
/100
|
#306
Tragic
$47,704
Bangladeshis
0.0
/100
|
#307
Tragic
$47,589
Comanche
0.0
/100
|
#308
Tragic
$47,518
U.S. Virgin Islanders
0.0
/100
|
#309
Tragic
$47,448
Iroquois
0.0
/100
|
#310
Tragic
$47,380
Ottawa
0.0
/100
|
#311
Tragic
$47,366
Bermudans
0.0
/100
|
#312
Tragic
$47,359
Delaware
0.0
/100
|
#313
Tragic
$47,159
Chippewa
0.0
/100
|
#314
Tragic
$47,015

Demographics Similar to Nepalese by Householder Income Under 25 years

In terms of householder income under 25 years, the demographic groups most similar to Nepalese are Immigrants from Southern Europe ($54,484, a difference of 0.020%), Immigrants from Brazil ($54,487, a difference of 0.030%), Immigrants from Italy ($54,449, a difference of 0.040%), Egyptian ($54,444, a difference of 0.050%), and Portuguese ($54,436, a difference of 0.060%).
DemographicsRating | RankHouseholder Income Under 25 years
Immigrants | Morocco
99.7
/100
|
#71
Exceptional
$54,593
Immigrants | Northern Europe
99.7
/100
|
#72
Exceptional
$54,571
Macedonians
99.7
/100
|
#73
Exceptional
$54,563
Immigrants | Grenada
99.7
/100
|
#74
Exceptional
$54,538
Immigrants | Sri Lanka
99.7
/100
|
#75
Exceptional
$54,512
Immigrants | Brazil
99.6
/100
|
#76
Exceptional
$54,487
Immigrants | Southern Europe
99.6
/100
|
#77
Exceptional
$54,484
Nepalese
99.6
/100
|
#78
Exceptional
$54,472
Immigrants | Italy
99.6
/100
|
#79
Exceptional
$54,449
Egyptians
99.6
/100
|
#80
Exceptional
$54,444
Portuguese
99.6
/100
|
#81
Exceptional
$54,436
Russians
99.5
/100
|
#82
Exceptional
$54,389
Laotians
99.5
/100
|
#83
Exceptional
$54,369
Bulgarians
99.5
/100
|
#84
Exceptional
$54,352
Immigrants | Czechoslovakia
99.5
/100
|
#85
Exceptional
$54,352