Bangladeshi vs Immigrants from Czechoslovakia Householder Income Under 25 years
COMPARE
Bangladeshi
Immigrants from Czechoslovakia
Householder Income Under 25 years
Householder Income Under 25 years Comparison
Bangladeshis
Immigrants from Czechoslovakia
$47,589
HOUSEHOLDER INCOME UNDER 25 YEARS
0.0/ 100
METRIC RATING
307th/ 347
METRIC RANK
$54,352
HOUSEHOLDER INCOME UNDER 25 YEARS
99.5/ 100
METRIC RATING
85th/ 347
METRIC RANK
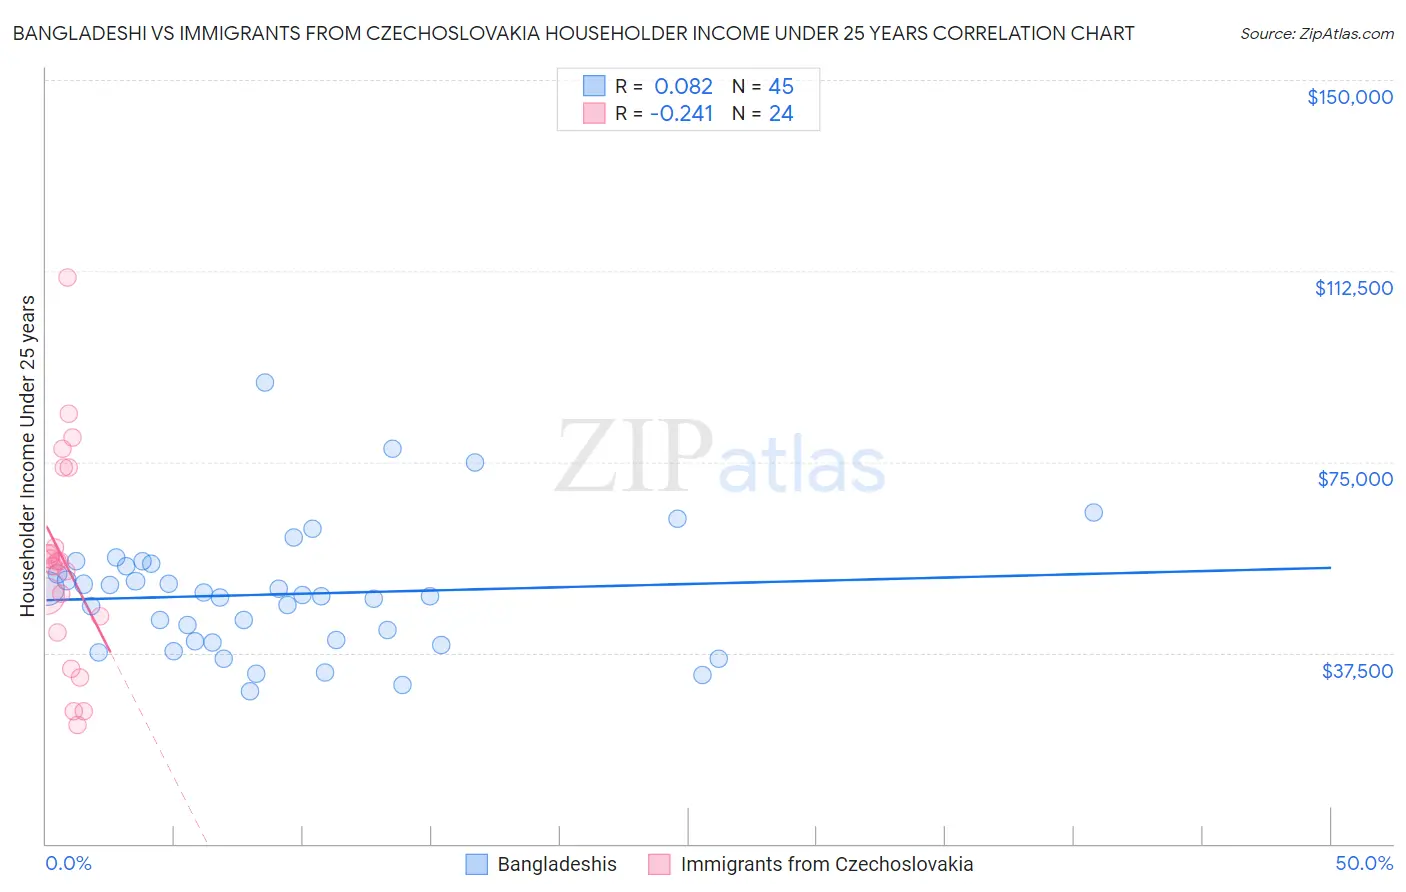
Bangladeshi vs Immigrants from Czechoslovakia Householder Income Under 25 years Correlation Chart
The statistical analysis conducted on geographies consisting of 131,389,647 people shows a slight positive correlation between the proportion of Bangladeshis and household income with householder under the age of 25 in the United States with a correlation coefficient (R) of 0.082 and weighted average of $47,589. Similarly, the statistical analysis conducted on geographies consisting of 171,200,377 people shows a weak negative correlation between the proportion of Immigrants from Czechoslovakia and household income with householder under the age of 25 in the United States with a correlation coefficient (R) of -0.241 and weighted average of $54,352, a difference of 14.2%.
Householder Income Under 25 years Correlation Summary
| Measurement | Bangladeshi | Immigrants from Czechoslovakia |
| Minimum | $29,883 | $23,355 |
| Maximum | $90,583 | $111,159 |
| Range | $60,700 | $87,804 |
| Mean | $49,001 | $55,385 |
| Median | $48,654 | $55,099 |
| Interquartile 25% (IQ1) | $39,531 | $43,094 |
| Interquartile 75% (IQ3) | $54,671 | $66,086 |
| Interquartile Range (IQR) | $15,140 | $22,993 |
| Standard Deviation (Sample) | $12,360 | $20,684 |
| Standard Deviation (Population) | $12,222 | $20,249 |
Similar Demographics by Householder Income Under 25 years
Demographics Similar to Bangladeshis by Householder Income Under 25 years
In terms of householder income under 25 years, the demographic groups most similar to Bangladeshis are Comanche ($47,518, a difference of 0.15%), Native/Alaskan ($47,704, a difference of 0.24%), U.S. Virgin Islander ($47,448, a difference of 0.30%), Iroquois ($47,380, a difference of 0.44%), and Ottawa ($47,366, a difference of 0.47%).
| Demographics | Rating | Rank | Householder Income Under 25 years |
| Immigrants | Somalia | 0.0 /100 | #300 | Tragic $48,135 |
| Immigrants | Kuwait | 0.0 /100 | #301 | Tragic $48,126 |
| Immigrants | Liberia | 0.0 /100 | #302 | Tragic $47,981 |
| Immigrants | Middle Africa | 0.0 /100 | #303 | Tragic $47,916 |
| Menominee | 0.0 /100 | #304 | Tragic $47,907 |
| Cherokee | 0.0 /100 | #305 | Tragic $47,848 |
| Natives/Alaskans | 0.0 /100 | #306 | Tragic $47,704 |
| Bangladeshis | 0.0 /100 | #307 | Tragic $47,589 |
| Comanche | 0.0 /100 | #308 | Tragic $47,518 |
| U.S. Virgin Islanders | 0.0 /100 | #309 | Tragic $47,448 |
| Iroquois | 0.0 /100 | #310 | Tragic $47,380 |
| Ottawa | 0.0 /100 | #311 | Tragic $47,366 |
| Bermudans | 0.0 /100 | #312 | Tragic $47,359 |
| Delaware | 0.0 /100 | #313 | Tragic $47,159 |
| Chippewa | 0.0 /100 | #314 | Tragic $47,015 |
Demographics Similar to Immigrants from Czechoslovakia by Householder Income Under 25 years
In terms of householder income under 25 years, the demographic groups most similar to Immigrants from Czechoslovakia are Bulgarian ($54,352, a difference of 0.0%), Immigrants from Croatia ($54,343, a difference of 0.020%), Laotian ($54,369, a difference of 0.030%), Brazilian ($54,335, a difference of 0.030%), and Yakama ($54,321, a difference of 0.060%).
| Demographics | Rating | Rank | Householder Income Under 25 years |
| Nepalese | 99.6 /100 | #78 | Exceptional $54,472 |
| Immigrants | Italy | 99.6 /100 | #79 | Exceptional $54,449 |
| Egyptians | 99.6 /100 | #80 | Exceptional $54,444 |
| Portuguese | 99.6 /100 | #81 | Exceptional $54,436 |
| Russians | 99.5 /100 | #82 | Exceptional $54,389 |
| Laotians | 99.5 /100 | #83 | Exceptional $54,369 |
| Bulgarians | 99.5 /100 | #84 | Exceptional $54,352 |
| Immigrants | Czechoslovakia | 99.5 /100 | #85 | Exceptional $54,352 |
| Immigrants | Croatia | 99.5 /100 | #86 | Exceptional $54,343 |
| Brazilians | 99.5 /100 | #87 | Exceptional $54,335 |
| Yakama | 99.5 /100 | #88 | Exceptional $54,321 |
| Immigrants | South America | 99.4 /100 | #89 | Exceptional $54,268 |
| Turks | 99.4 /100 | #90 | Exceptional $54,266 |
| Immigrants | Egypt | 99.3 /100 | #91 | Exceptional $54,239 |
| Immigrants | St. Vincent and the Grenadines | 99.3 /100 | #92 | Exceptional $54,230 |