Australian vs Nepalese Householder Income Under 25 years

COMPARE

Australian
Race
Ancestry
AfghanAfricanAlaska NativeAlaskan AthabascanAlbanianAleutAlsatianAmericanApacheArabArapahoArgentineanArmenianAssyrian/Chaldean/SyriacAustralianAustrianBahamianBangladeshiBarbadianBasqueBelgianBelizeanBermudanBhutaneseBlackfeetBolivianBrazilianBritishBritish West IndianBulgarianBurmeseCajunCambodianCanadianCape VerdeanCarpatho RusynCelticCentral AmericanCentral American IndianCherokeeCheyenneChickasawChileanChineseChippewaChoctawColombianColvilleComancheCosta RicanCreeCreekCroatianCrowCubanCypriotCzechCzechoslovakianDanishDelawareDominicanDutchDutch West IndianEastern EuropeanEcuadorianEgyptianEnglishEstonianEthiopianEuropeanFijianFilipinoFinnishFrenchFrench American IndianFrench CanadianGermanGerman RussianGhanaianGreekGuamanian/ChamorroGuatemalanGuyaneseHaitianHmongHonduranHopiHoumaHungarianIcelanderIndian (Asian)IndonesianInupiatIranianIraqiIrishIroquoisIsraeliItalianJamaicanJapaneseJordanianKenyanKiowaKoreanLaotianLatvianLebaneseLiberianLithuanianLumbeeLuxembourgerMacedonianMalaysianMalteseMarshalleseMenomineeMexicanMexican American IndianMongolianMoroccanNative HawaiianNavajoNew ZealanderNicaraguanNigerianNorthern EuropeanNorwegianOkinawanOsageOttawaPaiutePakistaniPalestinianPanamanianParaguayanPennsylvania GermanPeruvianPimaPolishPortuguesePotawatomiPuebloPuerto RicanPuget Sound SalishRomanianRussianSalvadoranSamoanScandinavianScotch-IrishScottishSeminoleSenegaleseSerbianShoshoneSierra LeoneanSiouxSlavicSlovakSloveneSomaliSouth AfricanSouth AmericanSouth American IndianSoviet UnionSpaniardSpanishSpanish AmericanSpanish American IndianSri LankanSubsaharan AfricanSudaneseSwedishSwissSyrianTaiwaneseThaiTlingit-HaidaTohono O'OdhamTonganTrinidadian and TobagonianTsimshianTurkishU.S. Virgin IslanderUgandanUkrainianUruguayanUteVenezuelanVietnameseWelshWest IndianYakamaYaquiYugoslavianYumanYup'ikZimbabwean
Immigration
NonimmigrantsImmigrantsAfghanistanAfricaAlbaniaArgentinaArmeniaAsiaAustraliaAustriaBahamasBangladeshBarbadosBelarusBelgiumBelizeBoliviaBosnia and HerzegovinaBrazilBulgariaBurma/MyanmarCabo VerdeCambodiaCameroonCanadaCaribbeanCentral AmericaChileChinaColombiaCongoCosta RicaCroatiaCubaCzechoslovakiaDenmarkDominicaDominican RepublicEastern AfricaEastern AsiaEastern EuropeEcuadorEgyptEl SalvadorEnglandEritreaEthiopiaEuropeFijiFranceGermanyGhanaGreeceGrenadaGuatemalaGuyanaHaitiHondurasHong KongHungaryIndiaIndonesiaIranIraqIrelandIsraelItalyJamaicaJapanJordanKazakhstanKenyaKoreaKuwaitLaosLatin AmericaLatviaLebanonLiberiaLithuaniaMalaysiaMexicoMicronesiaMiddle AfricaMoldovaMoroccoNepalNetherlandsNicaraguaNigeriaNorth AmericaNorth MacedoniaNorthern AfricaNorthern EuropeNorwayOceaniaPakistanPanamaPeruPhilippinesPolandPortugalRomaniaRussiaSaudi ArabiaScotlandSenegalSerbiaSierra LeoneSingaporeSomaliaSouth AfricaSouth AmericaSouth Central AsiaSouth Eastern AsiaSouthern EuropeSpainSri LankaSt. Vincent and the GrenadinesSudanSwedenSwitzerlandSyriaTaiwanThailandTrinidad and TobagoTurkeyUgandaUkraineUruguayUzbekistanVenezuelaVietnamWest IndiesWestern AfricaWestern AsiaWestern EuropeYemenZaireZimbabweAzores
Nepalese
Race
Ancestry
AfghanAfricanAlaska NativeAlaskan AthabascanAlbanianAleutAlsatianAmericanApacheArabArapahoArgentineanArmenianAssyrian/Chaldean/SyriacAustrianBahamianBangladeshiBarbadianBasqueBelgianBelizeanBermudanBhutaneseBlackfeetBolivianBrazilianBritishBritish West IndianBulgarianBurmeseCajunCambodianCanadianCape VerdeanCarpatho RusynCelticCentral AmericanCentral American IndianCherokeeCheyenneChickasawChileanChineseChippewaChoctawColombianColvilleComancheCosta RicanCreeCreekCroatianCrowCubanCypriotCzechCzechoslovakianDanishDelawareDominicanDutchDutch West IndianEastern EuropeanEcuadorianEgyptianEnglishEstonianEthiopianEuropeanFijianFilipinoFinnishFrenchFrench American IndianFrench CanadianGermanGerman RussianGhanaianGreekGuamanian/ChamorroGuatemalanGuyaneseHaitianHmongHonduranHopiHoumaHungarianIcelanderIndian (Asian)IndonesianInupiatIranianIraqiIrishIroquoisIsraeliItalianJamaicanJapaneseJordanianKenyanKiowaKoreanLaotianLatvianLebaneseLiberianLithuanianLumbeeLuxembourgerMacedonianMalaysianMalteseMarshalleseMenomineeMexicanMexican American IndianMongolianMoroccanNative HawaiianNavajoNepaleseNew ZealanderNicaraguanNigerianNorthern EuropeanNorwegianOkinawanOsageOttawaPaiutePakistaniPalestinianPanamanianParaguayanPennsylvania GermanPeruvianPimaPolishPortuguesePotawatomiPuebloPuerto RicanPuget Sound SalishRomanianRussianSalvadoranSamoanScandinavianScotch-IrishScottishSeminoleSenegaleseSerbianShoshoneSierra LeoneanSiouxSlavicSlovakSloveneSomaliSouth AfricanSouth AmericanSouth American IndianSoviet UnionSpaniardSpanishSpanish AmericanSpanish American IndianSri LankanSubsaharan AfricanSudaneseSwedishSwissSyrianTaiwaneseThaiTlingit-HaidaTohono O'OdhamTonganTrinidadian and TobagonianTsimshianTurkishU.S. Virgin IslanderUgandanUkrainianUruguayanUteVenezuelanVietnameseWelshWest IndianYakamaYaquiYugoslavianYumanYup'ikZimbabwean
Immigration
NonimmigrantsImmigrantsAfghanistanAfricaAlbaniaArgentinaArmeniaAsiaAustraliaAustriaBahamasBangladeshBarbadosBelarusBelgiumBelizeBoliviaBosnia and HerzegovinaBrazilBulgariaBurma/MyanmarCabo VerdeCambodiaCameroonCanadaCaribbeanCentral AmericaChileChinaColombiaCongoCosta RicaCroatiaCubaCzechoslovakiaDenmarkDominicaDominican RepublicEastern AfricaEastern AsiaEastern EuropeEcuadorEgyptEl SalvadorEnglandEritreaEthiopiaEuropeFijiFranceGermanyGhanaGreeceGrenadaGuatemalaGuyanaHaitiHondurasHong KongHungaryIndiaIndonesiaIranIraqIrelandIsraelItalyJamaicaJapanJordanKazakhstanKenyaKoreaKuwaitLaosLatin AmericaLatviaLebanonLiberiaLithuaniaMalaysiaMexicoMicronesiaMiddle AfricaMoldovaMoroccoNepalNetherlandsNicaraguaNigeriaNorth AmericaNorth MacedoniaNorthern AfricaNorthern EuropeNorwayOceaniaPakistanPanamaPeruPhilippinesPolandPortugalRomaniaRussiaSaudi ArabiaScotlandSenegalSerbiaSierra LeoneSingaporeSomaliaSouth AfricaSouth AmericaSouth Central AsiaSouth Eastern AsiaSouthern EuropeSpainSri LankaSt. Vincent and the GrenadinesSudanSwedenSwitzerlandSyriaTaiwanThailandTrinidad and TobagoTurkeyUgandaUkraineUruguayUzbekistanVenezuelaVietnamWest IndiesWestern AfricaWestern AsiaWestern EuropeYemenZaireZimbabweAzores
Householder Income Under 25 years
Income
Poverty
Unemployment
Labor Participation
Family Structure
Vehicle Availability
Education Level
Disability

Householder Income Under 25 years Comparison

Australians

Nepalese

Exceptional
Exceptional
$53,739
HOUSEHOLDER INCOME UNDER 25 YEARS
97.8/ 100
METRIC RATING
107th/ 347
METRIC RANK
$54,472
HOUSEHOLDER INCOME UNDER 25 YEARS
99.6/ 100
METRIC RATING
78th/ 347
METRIC RANK

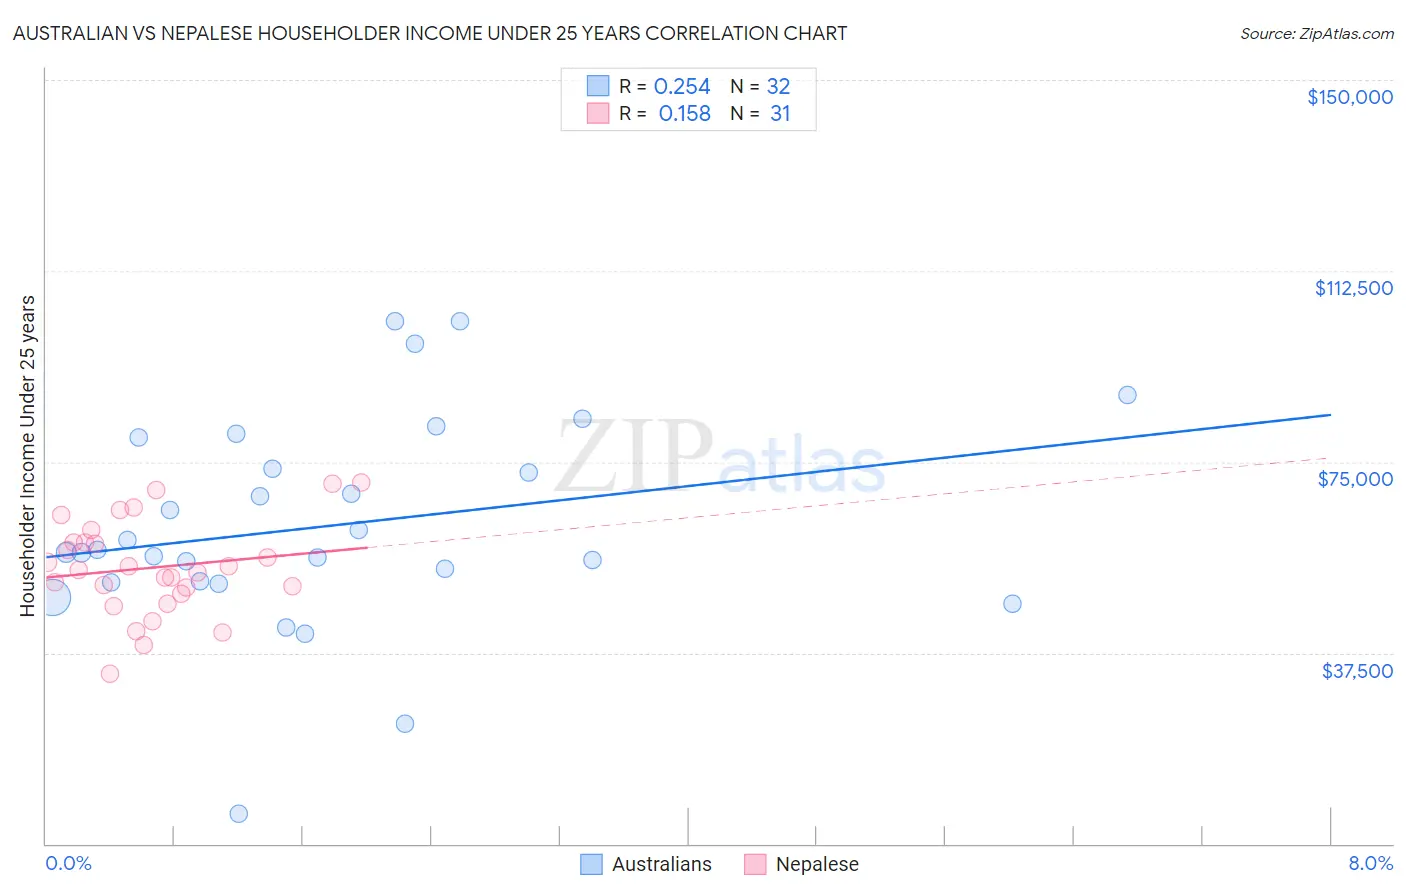
Australian vs Nepalese Householder Income Under 25 years Correlation Chart

The statistical analysis conducted on geographies consisting of 200,158,480 people shows a weak positive correlation between the proportion of Australians and household income with householder under the age of 25 in the United States with a correlation coefficient (R) of 0.254 and weighted average of $53,739. Similarly, the statistical analysis conducted on geographies consisting of 22,881,746 people shows a poor positive correlation between the proportion of Nepalese and household income with householder under the age of 25 in the United States with a correlation coefficient (R) of 0.158 and weighted average of $54,472, a difference of 1.4%.
Australian vs Nepalese Householder Income Under 25 years

Householder Income Under 25 years Correlation Summary

MeasurementAustralianNepalese
Minimum$6,009$33,325
Maximum$102,500$70,914
Range$96,491$37,589
Mean$62,514$54,229
Median$57,436$53,846
Interquartile 25% (IQ1)$51,485$49,219
Interquartile 75% (IQ3)$76,760$59,177
Interquartile Range (IQR)$25,275$9,958
Standard Deviation (Sample)$20,939$9,280
Standard Deviation (Population)$20,609$9,129

Similar Demographics by Householder Income Under 25 years

Demographics Similar to Australians by Householder Income Under 25 years

In terms of householder income under 25 years, the demographic groups most similar to Australians are Maltese ($53,735, a difference of 0.010%), Immigrants from Ecuador ($53,722, a difference of 0.030%), Greek ($53,715, a difference of 0.040%), Immigrants from Colombia ($53,714, a difference of 0.050%), and Albanian ($53,794, a difference of 0.10%).
DemographicsRating | RankHouseholder Income Under 25 years
Immigrants | Kazakhstan
98.8
/100
|
#100
Exceptional
$53,990
South Americans
98.6
/100
|
#101
Exceptional
$53,939
Ecuadorians
98.5
/100
|
#102
Exceptional
$53,911
Ukrainians
98.3
/100
|
#103
Exceptional
$53,843
Ethiopians
98.2
/100
|
#104
Exceptional
$53,818
Immigrants | France
98.1
/100
|
#105
Exceptional
$53,805
Albanians
98.1
/100
|
#106
Exceptional
$53,794
Australians
97.8
/100
|
#107
Exceptional
$53,739
Maltese
97.8
/100
|
#108
Exceptional
$53,735
Immigrants | Ecuador
97.7
/100
|
#109
Exceptional
$53,722
Greeks
97.7
/100
|
#110
Exceptional
$53,715
Immigrants | Colombia
97.7
/100
|
#111
Exceptional
$53,714
Immigrants | Oceania
97.5
/100
|
#112
Exceptional
$53,680
Romanians
97.2
/100
|
#113
Exceptional
$53,632
Immigrants | Sweden
97.1
/100
|
#114
Exceptional
$53,621

Demographics Similar to Nepalese by Householder Income Under 25 years

In terms of householder income under 25 years, the demographic groups most similar to Nepalese are Immigrants from Southern Europe ($54,484, a difference of 0.020%), Immigrants from Brazil ($54,487, a difference of 0.030%), Immigrants from Italy ($54,449, a difference of 0.040%), Egyptian ($54,444, a difference of 0.050%), and Portuguese ($54,436, a difference of 0.060%).
DemographicsRating | RankHouseholder Income Under 25 years
Immigrants | Morocco
99.7
/100
|
#71
Exceptional
$54,593
Immigrants | Northern Europe
99.7
/100
|
#72
Exceptional
$54,571
Macedonians
99.7
/100
|
#73
Exceptional
$54,563
Immigrants | Grenada
99.7
/100
|
#74
Exceptional
$54,538
Immigrants | Sri Lanka
99.7
/100
|
#75
Exceptional
$54,512
Immigrants | Brazil
99.6
/100
|
#76
Exceptional
$54,487
Immigrants | Southern Europe
99.6
/100
|
#77
Exceptional
$54,484
Nepalese
99.6
/100
|
#78
Exceptional
$54,472
Immigrants | Italy
99.6
/100
|
#79
Exceptional
$54,449
Egyptians
99.6
/100
|
#80
Exceptional
$54,444
Portuguese
99.6
/100
|
#81
Exceptional
$54,436
Russians
99.5
/100
|
#82
Exceptional
$54,389
Laotians
99.5
/100
|
#83
Exceptional
$54,369
Bulgarians
99.5
/100
|
#84
Exceptional
$54,352
Immigrants | Czechoslovakia
99.5
/100
|
#85
Exceptional
$54,352