Bahamian vs Immigrants from Hong Kong Median Family Income
COMPARE
Bahamian
Immigrants from Hong Kong
Median Family Income
Median Family Income Comparison
Bahamians
Immigrants from Hong Kong
$82,631
MEDIAN FAMILY INCOME
0.0/ 100
METRIC RATING
323rd/ 347
METRIC RANK
$131,067
MEDIAN FAMILY INCOME
100.0/ 100
METRIC RATING
7th/ 347
METRIC RANK
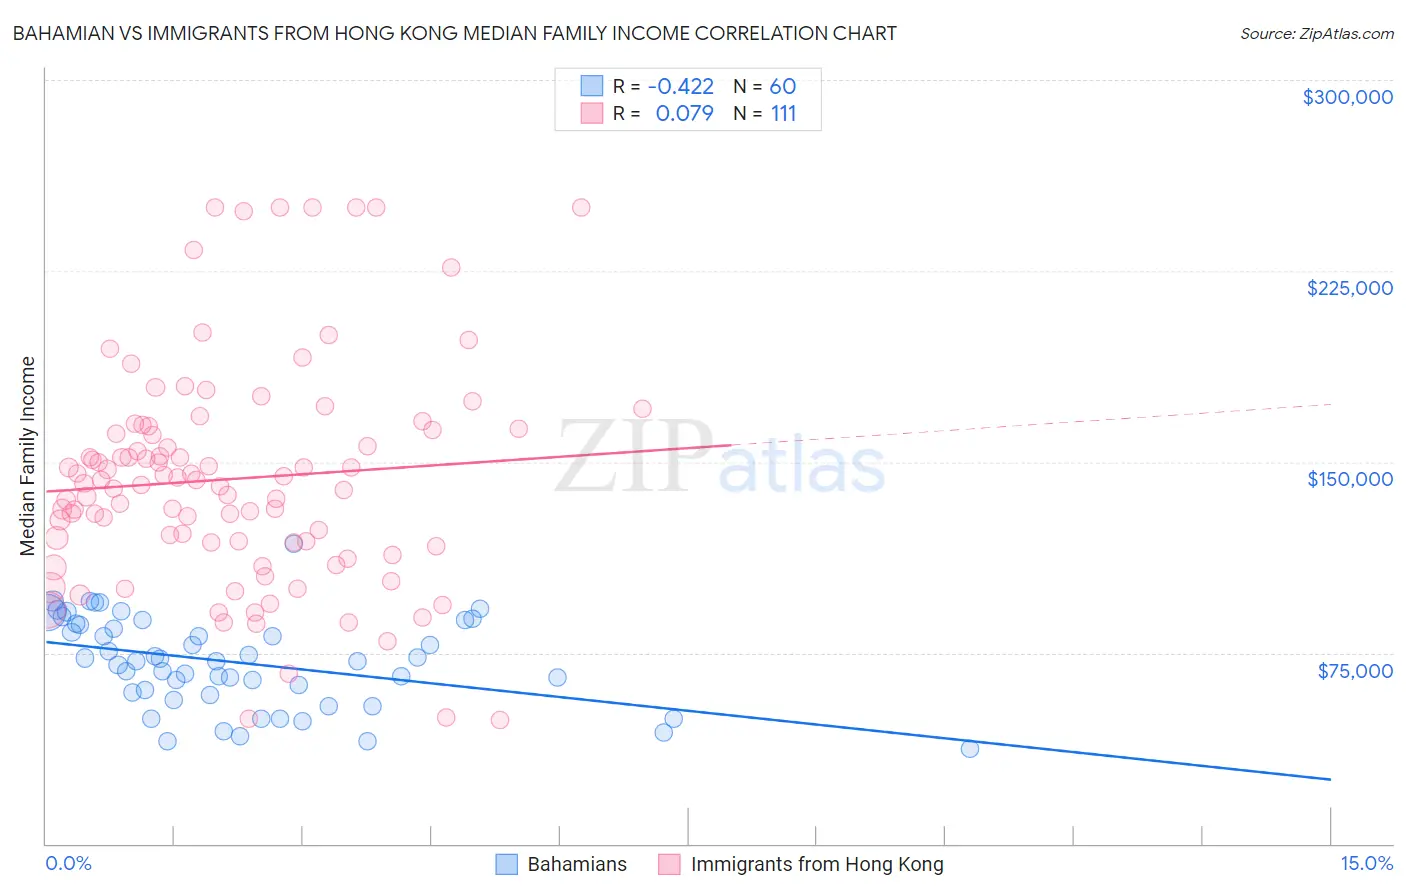
Bahamian vs Immigrants from Hong Kong Median Family Income Correlation Chart
The statistical analysis conducted on geographies consisting of 112,596,489 people shows a moderate negative correlation between the proportion of Bahamians and median family income in the United States with a correlation coefficient (R) of -0.422 and weighted average of $82,631. Similarly, the statistical analysis conducted on geographies consisting of 253,853,035 people shows a slight positive correlation between the proportion of Immigrants from Hong Kong and median family income in the United States with a correlation coefficient (R) of 0.079 and weighted average of $131,067, a difference of 58.6%.
Median Family Income Correlation Summary
| Measurement | Bahamian | Immigrants from Hong Kong |
| Minimum | $37,231 | $48,750 |
| Maximum | $118,067 | $250,001 |
| Range | $80,836 | $201,251 |
| Mean | $71,118 | $143,316 |
| Median | $71,812 | $141,440 |
| Interquartile 25% (IQ1) | $59,044 | $118,209 |
| Interquartile 75% (IQ3) | $86,176 | $163,135 |
| Interquartile Range (IQR) | $27,132 | $44,926 |
| Standard Deviation (Sample) | $17,647 | $43,770 |
| Standard Deviation (Population) | $17,499 | $43,572 |
Similar Demographics by Median Family Income
Demographics Similar to Bahamians by Median Family Income
In terms of median family income, the demographic groups most similar to Bahamians are Creek ($82,560, a difference of 0.090%), Sioux ($82,386, a difference of 0.30%), Dominican ($82,888, a difference of 0.31%), Immigrants from Congo ($82,216, a difference of 0.51%), and Arapaho ($82,064, a difference of 0.69%).
| Demographics | Rating | Rank | Median Family Income |
| Immigrants | Haiti | 0.0 /100 | #316 | Tragic $84,018 |
| Yakama | 0.0 /100 | #317 | Tragic $83,932 |
| Immigrants | Mexico | 0.0 /100 | #318 | Tragic $83,639 |
| Immigrants | Honduras | 0.0 /100 | #319 | Tragic $83,618 |
| Seminole | 0.0 /100 | #320 | Tragic $83,354 |
| Immigrants | Caribbean | 0.0 /100 | #321 | Tragic $83,319 |
| Dominicans | 0.0 /100 | #322 | Tragic $82,888 |
| Bahamians | 0.0 /100 | #323 | Tragic $82,631 |
| Creek | 0.0 /100 | #324 | Tragic $82,560 |
| Sioux | 0.0 /100 | #325 | Tragic $82,386 |
| Immigrants | Congo | 0.0 /100 | #326 | Tragic $82,216 |
| Arapaho | 0.0 /100 | #327 | Tragic $82,064 |
| Blacks/African Americans | 0.0 /100 | #328 | Tragic $81,912 |
| Dutch West Indians | 0.0 /100 | #329 | Tragic $81,852 |
| Cheyenne | 0.0 /100 | #330 | Tragic $81,385 |
Demographics Similar to Immigrants from Hong Kong by Median Family Income
In terms of median family income, the demographic groups most similar to Immigrants from Hong Kong are Immigrants from Iran ($130,894, a difference of 0.13%), Thai ($131,281, a difference of 0.16%), Okinawan ($129,979, a difference of 0.84%), Iranian ($133,839, a difference of 2.1%), and Immigrants from India ($134,028, a difference of 2.3%).
| Demographics | Rating | Rank | Median Family Income |
| Filipinos | 100.0 /100 | #1 | Exceptional $138,397 |
| Immigrants | Taiwan | 100.0 /100 | #2 | Exceptional $136,949 |
| Immigrants | Singapore | 100.0 /100 | #3 | Exceptional $134,818 |
| Immigrants | India | 100.0 /100 | #4 | Exceptional $134,028 |
| Iranians | 100.0 /100 | #5 | Exceptional $133,839 |
| Thais | 100.0 /100 | #6 | Exceptional $131,281 |
| Immigrants | Hong Kong | 100.0 /100 | #7 | Exceptional $131,067 |
| Immigrants | Iran | 100.0 /100 | #8 | Exceptional $130,894 |
| Okinawans | 100.0 /100 | #9 | Exceptional $129,979 |
| Immigrants | Ireland | 100.0 /100 | #10 | Exceptional $127,584 |
| Immigrants | Israel | 100.0 /100 | #11 | Exceptional $127,430 |
| Cypriots | 100.0 /100 | #12 | Exceptional $127,064 |
| Immigrants | Australia | 100.0 /100 | #13 | Exceptional $126,620 |
| Immigrants | South Central Asia | 100.0 /100 | #14 | Exceptional $125,956 |
| Eastern Europeans | 100.0 /100 | #15 | Exceptional $125,546 |