Bahamian vs Immigrants from Dominica Median Household Income
COMPARE
Bahamian
Immigrants from Dominica
Median Household Income
Median Household Income Comparison
Bahamians
Immigrants from Dominica
$69,726
MEDIAN HOUSEHOLD INCOME
0.0/ 100
METRIC RATING
323rd/ 347
METRIC RANK
$72,760
MEDIAN HOUSEHOLD INCOME
0.0/ 100
METRIC RATING
300th/ 347
METRIC RANK
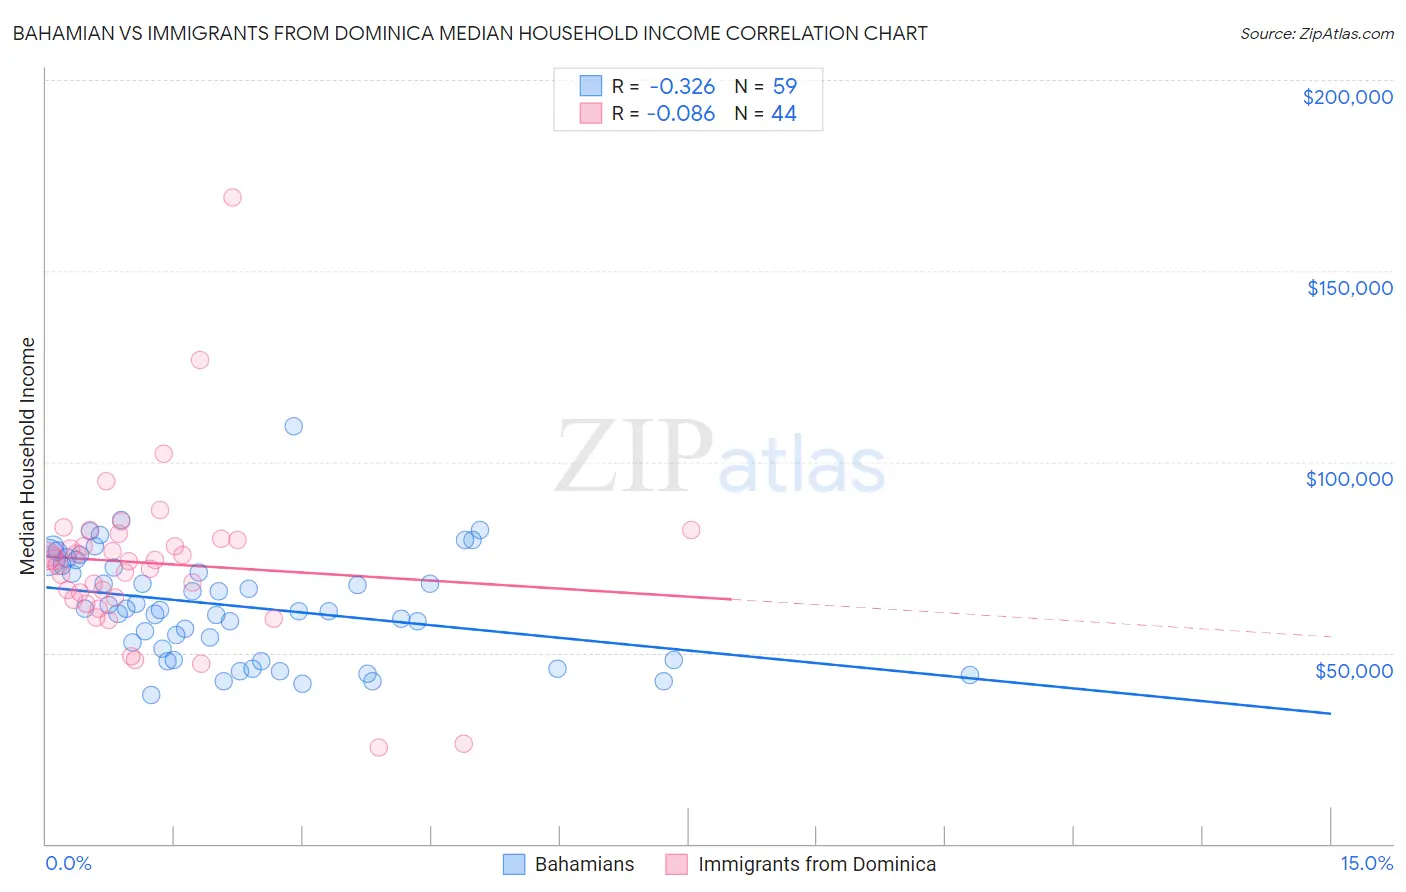
Bahamian vs Immigrants from Dominica Median Household Income Correlation Chart
The statistical analysis conducted on geographies consisting of 112,607,468 people shows a mild negative correlation between the proportion of Bahamians and median household income in the United States with a correlation coefficient (R) of -0.326 and weighted average of $69,726. Similarly, the statistical analysis conducted on geographies consisting of 83,788,429 people shows a slight negative correlation between the proportion of Immigrants from Dominica and median household income in the United States with a correlation coefficient (R) of -0.086 and weighted average of $72,760, a difference of 4.3%.
Median Household Income Correlation Summary
| Measurement | Bahamian | Immigrants from Dominica |
| Minimum | $38,952 | $25,050 |
| Maximum | $109,393 | $169,141 |
| Range | $70,441 | $144,091 |
| Mean | $62,193 | $73,512 |
| Median | $61,085 | $74,253 |
| Interquartile 25% (IQ1) | $48,214 | $64,327 |
| Interquartile 75% (IQ3) | $73,042 | $79,686 |
| Interquartile Range (IQR) | $24,828 | $15,359 |
| Standard Deviation (Sample) | $14,104 | $22,542 |
| Standard Deviation (Population) | $13,984 | $22,284 |
Similar Demographics by Median Household Income
Demographics Similar to Bahamians by Median Household Income
In terms of median household income, the demographic groups most similar to Bahamians are Yup'ik ($69,695, a difference of 0.040%), Choctaw ($69,947, a difference of 0.32%), Chickasaw ($70,005, a difference of 0.40%), Seminole ($69,420, a difference of 0.44%), and Colville ($70,094, a difference of 0.53%).
| Demographics | Rating | Rank | Median Household Income |
| Apache | 0.0 /100 | #316 | Tragic $70,927 |
| Cajuns | 0.0 /100 | #317 | Tragic $70,605 |
| Chippewa | 0.0 /100 | #318 | Tragic $70,539 |
| Immigrants | Dominican Republic | 0.0 /100 | #319 | Tragic $70,208 |
| Colville | 0.0 /100 | #320 | Tragic $70,094 |
| Chickasaw | 0.0 /100 | #321 | Tragic $70,005 |
| Choctaw | 0.0 /100 | #322 | Tragic $69,947 |
| Bahamians | 0.0 /100 | #323 | Tragic $69,726 |
| Yup'ik | 0.0 /100 | #324 | Tragic $69,695 |
| Seminole | 0.0 /100 | #325 | Tragic $69,420 |
| Yuman | 0.0 /100 | #326 | Tragic $68,743 |
| Immigrants | Cuba | 0.0 /100 | #327 | Tragic $68,461 |
| Menominee | 0.0 /100 | #328 | Tragic $68,423 |
| Dutch West Indians | 0.0 /100 | #329 | Tragic $68,412 |
| Arapaho | 0.0 /100 | #330 | Tragic $67,965 |
Demographics Similar to Immigrants from Dominica by Median Household Income
In terms of median household income, the demographic groups most similar to Immigrants from Dominica are Cherokee ($72,682, a difference of 0.11%), Indonesian ($72,856, a difference of 0.13%), Shoshone ($72,660, a difference of 0.14%), African ($72,650, a difference of 0.15%), and Immigrants from Haiti ($72,599, a difference of 0.22%).
| Demographics | Rating | Rank | Median Household Income |
| Immigrants | Cabo Verde | 0.1 /100 | #293 | Tragic $73,515 |
| Blackfeet | 0.1 /100 | #294 | Tragic $73,509 |
| Cubans | 0.1 /100 | #295 | Tragic $73,392 |
| Haitians | 0.1 /100 | #296 | Tragic $73,306 |
| Immigrants | Mexico | 0.0 /100 | #297 | Tragic $73,160 |
| Paiute | 0.0 /100 | #298 | Tragic $72,959 |
| Indonesians | 0.0 /100 | #299 | Tragic $72,856 |
| Immigrants | Dominica | 0.0 /100 | #300 | Tragic $72,760 |
| Cherokee | 0.0 /100 | #301 | Tragic $72,682 |
| Shoshone | 0.0 /100 | #302 | Tragic $72,660 |
| Africans | 0.0 /100 | #303 | Tragic $72,650 |
| Immigrants | Haiti | 0.0 /100 | #304 | Tragic $72,599 |
| Hondurans | 0.0 /100 | #305 | Tragic $72,588 |
| Potawatomi | 0.0 /100 | #306 | Tragic $72,576 |
| Ute | 0.0 /100 | #307 | Tragic $72,402 |