Assyrian/Chaldean/Syriac vs Central American Per Capita Income
COMPARE
Assyrian/Chaldean/Syriac
Central American
Per Capita Income
Per Capita Income Comparison
Assyrians/Chaldeans/Syriacs
Central Americans
$45,195
PER CAPITA INCOME
84.8/ 100
METRIC RATING
138th/ 347
METRIC RANK
$38,560
PER CAPITA INCOME
0.3/ 100
METRIC RATING
271st/ 347
METRIC RANK
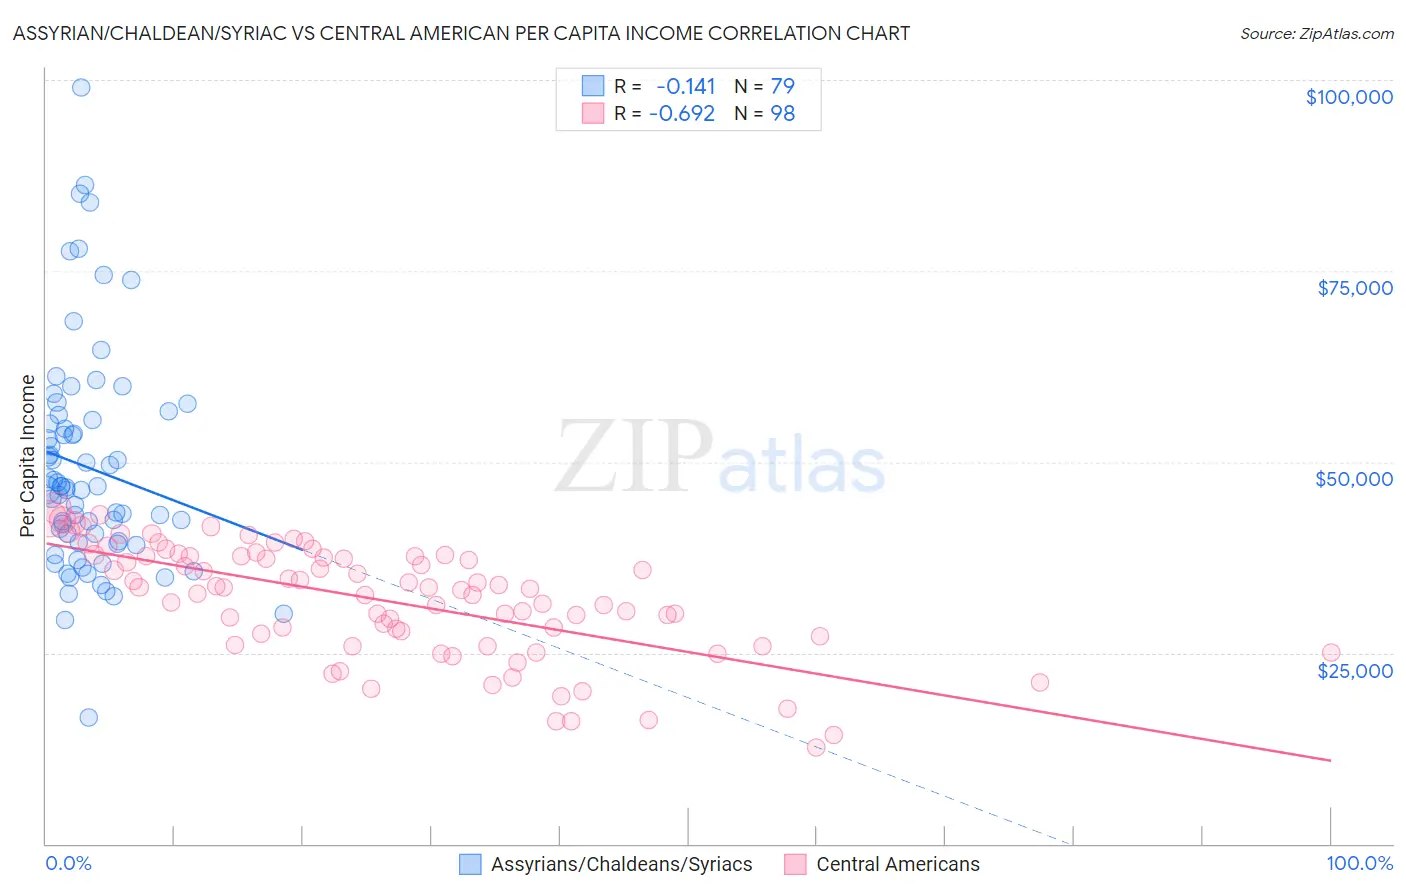
Assyrian/Chaldean/Syriac vs Central American Per Capita Income Correlation Chart
The statistical analysis conducted on geographies consisting of 110,311,560 people shows a poor negative correlation between the proportion of Assyrians/Chaldeans/Syriacs and per capita income in the United States with a correlation coefficient (R) of -0.141 and weighted average of $45,195. Similarly, the statistical analysis conducted on geographies consisting of 504,669,146 people shows a significant negative correlation between the proportion of Central Americans and per capita income in the United States with a correlation coefficient (R) of -0.692 and weighted average of $38,560, a difference of 17.2%.
Per Capita Income Correlation Summary
| Measurement | Assyrian/Chaldean/Syriac | Central American |
| Minimum | $16,468 | $12,606 |
| Maximum | $99,080 | $43,950 |
| Range | $82,612 | $31,344 |
| Mean | $49,218 | $31,868 |
| Median | $46,715 | $33,444 |
| Interquartile 25% (IQ1) | $39,451 | $27,188 |
| Interquartile 75% (IQ3) | $55,554 | $37,671 |
| Interquartile Range (IQR) | $16,103 | $10,483 |
| Standard Deviation (Sample) | $14,590 | $7,379 |
| Standard Deviation (Population) | $14,497 | $7,341 |
Similar Demographics by Per Capita Income
Demographics Similar to Assyrians/Chaldeans/Syriacs by Per Capita Income
In terms of per capita income, the demographic groups most similar to Assyrians/Chaldeans/Syriacs are Immigrants from Syria ($45,218, a difference of 0.050%), Immigrants from Oceania ($45,220, a difference of 0.060%), Basque ($45,086, a difference of 0.24%), Immigrants from Jordan ($45,066, a difference of 0.29%), and Slavic ($45,049, a difference of 0.32%).
| Demographics | Rating | Rank | Per Capita Income |
| Immigrants | North Macedonia | 90.0 /100 | #131 | Exceptional $45,622 |
| Jordanians | 89.9 /100 | #132 | Excellent $45,605 |
| Pakistanis | 89.7 /100 | #133 | Excellent $45,587 |
| Slovenes | 89.6 /100 | #134 | Excellent $45,581 |
| Hungarians | 87.9 /100 | #135 | Excellent $45,426 |
| Immigrants | Oceania | 85.2 /100 | #136 | Excellent $45,220 |
| Immigrants | Syria | 85.2 /100 | #137 | Excellent $45,218 |
| Assyrians/Chaldeans/Syriacs | 84.8 /100 | #138 | Excellent $45,195 |
| Basques | 83.2 /100 | #139 | Excellent $45,086 |
| Immigrants | Jordan | 82.9 /100 | #140 | Excellent $45,066 |
| Slavs | 82.6 /100 | #141 | Excellent $45,049 |
| Ugandans | 82.6 /100 | #142 | Excellent $45,047 |
| Immigrants | Uganda | 82.5 /100 | #143 | Excellent $45,043 |
| Icelanders | 81.6 /100 | #144 | Excellent $44,987 |
| Immigrants | Afghanistan | 78.0 /100 | #145 | Good $44,790 |
Demographics Similar to Central Americans by Per Capita Income
In terms of per capita income, the demographic groups most similar to Central Americans are Immigrants from Cabo Verde ($38,540, a difference of 0.050%), Immigrants from Belize ($38,614, a difference of 0.14%), Nepalese ($38,442, a difference of 0.31%), Immigrants from El Salvador ($38,394, a difference of 0.43%), and Immigrants from Jamaica ($38,766, a difference of 0.53%).
| Demographics | Rating | Rank | Per Capita Income |
| Americans | 0.6 /100 | #264 | Tragic $39,039 |
| Spanish Americans | 0.5 /100 | #265 | Tragic $39,012 |
| Salvadorans | 0.5 /100 | #266 | Tragic $38,858 |
| Immigrants | Zaire | 0.4 /100 | #267 | Tragic $38,848 |
| Liberians | 0.4 /100 | #268 | Tragic $38,780 |
| Immigrants | Jamaica | 0.4 /100 | #269 | Tragic $38,766 |
| Immigrants | Belize | 0.3 /100 | #270 | Tragic $38,614 |
| Central Americans | 0.3 /100 | #271 | Tragic $38,560 |
| Immigrants | Cabo Verde | 0.3 /100 | #272 | Tragic $38,540 |
| Nepalese | 0.3 /100 | #273 | Tragic $38,442 |
| Immigrants | El Salvador | 0.3 /100 | #274 | Tragic $38,394 |
| Immigrants | Liberia | 0.2 /100 | #275 | Tragic $38,165 |
| Hmong | 0.2 /100 | #276 | Tragic $38,120 |
| Comanche | 0.2 /100 | #277 | Tragic $38,088 |
| Immigrants | Nicaragua | 0.2 /100 | #278 | Tragic $38,065 |