Asian vs Swedish Median Family Income
COMPARE
Asian
Swedish
Median Family Income
Median Family Income Comparison
Asians
Swedes
$119,955
MEDIAN FAMILY INCOME
100.0/ 100
METRIC RATING
32nd/ 347
METRIC RANK
$108,499
MEDIAN FAMILY INCOME
95.1/ 100
METRIC RATING
115th/ 347
METRIC RANK
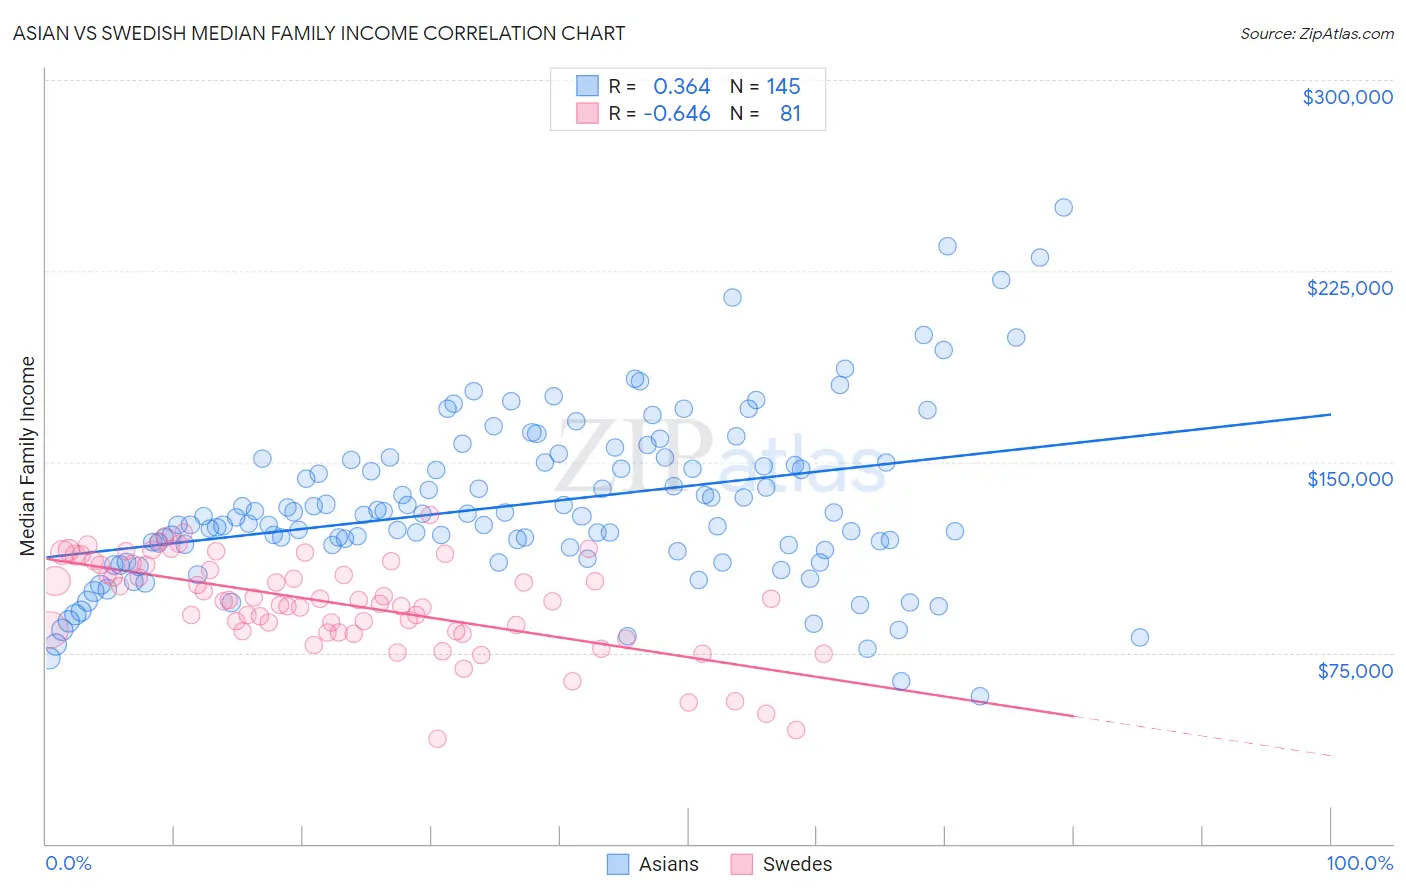
Asian vs Swedish Median Family Income Correlation Chart
The statistical analysis conducted on geographies consisting of 549,758,807 people shows a mild positive correlation between the proportion of Asians and median family income in the United States with a correlation coefficient (R) of 0.364 and weighted average of $119,955. Similarly, the statistical analysis conducted on geographies consisting of 538,326,829 people shows a significant negative correlation between the proportion of Swedes and median family income in the United States with a correlation coefficient (R) of -0.646 and weighted average of $108,499, a difference of 10.6%.
Median Family Income Correlation Summary
| Measurement | Asian | Swedish |
| Minimum | $58,163 | $41,250 |
| Maximum | $250,001 | $128,899 |
| Range | $191,838 | $87,649 |
| Mean | $133,077 | $94,659 |
| Median | $128,500 | $95,565 |
| Interquartile 25% (IQ1) | $115,250 | $83,510 |
| Interquartile 75% (IQ3) | $150,323 | $109,800 |
| Interquartile Range (IQR) | $35,073 | $26,290 |
| Standard Deviation (Sample) | $33,384 | $18,382 |
| Standard Deviation (Population) | $33,269 | $18,268 |
Similar Demographics by Median Family Income
Demographics Similar to Asians by Median Family Income
In terms of median family income, the demographic groups most similar to Asians are Immigrants from France ($120,076, a difference of 0.10%), Bhutanese ($119,800, a difference of 0.13%), Immigrants from Sri Lanka ($120,263, a difference of 0.26%), Latvian ($120,301, a difference of 0.29%), and Bolivian ($119,479, a difference of 0.40%).
| Demographics | Rating | Rank | Median Family Income |
| Turks | 100.0 /100 | #25 | Exceptional $121,202 |
| Immigrants | Switzerland | 100.0 /100 | #26 | Exceptional $120,726 |
| Russians | 100.0 /100 | #27 | Exceptional $120,487 |
| Immigrants | Denmark | 100.0 /100 | #28 | Exceptional $120,445 |
| Latvians | 100.0 /100 | #29 | Exceptional $120,301 |
| Immigrants | Sri Lanka | 100.0 /100 | #30 | Exceptional $120,263 |
| Immigrants | France | 100.0 /100 | #31 | Exceptional $120,076 |
| Asians | 100.0 /100 | #32 | Exceptional $119,955 |
| Bhutanese | 100.0 /100 | #33 | Exceptional $119,800 |
| Bolivians | 100.0 /100 | #34 | Exceptional $119,479 |
| Soviet Union | 100.0 /100 | #35 | Exceptional $119,262 |
| Israelis | 100.0 /100 | #36 | Exceptional $118,577 |
| Australians | 100.0 /100 | #37 | Exceptional $118,440 |
| Immigrants | Turkey | 100.0 /100 | #38 | Exceptional $118,325 |
| Immigrants | Asia | 100.0 /100 | #39 | Exceptional $118,291 |
Demographics Similar to Swedes by Median Family Income
In terms of median family income, the demographic groups most similar to Swedes are Polish ($108,507, a difference of 0.010%), Immigrants from Saudi Arabia ($108,544, a difference of 0.040%), Chilean ($108,429, a difference of 0.060%), Immigrants from Poland ($108,570, a difference of 0.070%), and Immigrants from Western Asia ($108,691, a difference of 0.18%).
| Demographics | Rating | Rank | Median Family Income |
| Immigrants | Zimbabwe | 95.9 /100 | #108 | Exceptional $108,830 |
| Immigrants | Afghanistan | 95.6 /100 | #109 | Exceptional $108,709 |
| British | 95.6 /100 | #110 | Exceptional $108,705 |
| Immigrants | Western Asia | 95.6 /100 | #111 | Exceptional $108,691 |
| Immigrants | Poland | 95.3 /100 | #112 | Exceptional $108,570 |
| Immigrants | Saudi Arabia | 95.2 /100 | #113 | Exceptional $108,544 |
| Poles | 95.2 /100 | #114 | Exceptional $108,507 |
| Swedes | 95.1 /100 | #115 | Exceptional $108,499 |
| Chileans | 95.0 /100 | #116 | Exceptional $108,429 |
| Immigrants | Philippines | 94.6 /100 | #117 | Exceptional $108,288 |
| Ethiopians | 94.5 /100 | #118 | Exceptional $108,251 |
| Sri Lankans | 94.5 /100 | #119 | Exceptional $108,234 |
| Immigrants | Northern Africa | 94.3 /100 | #120 | Exceptional $108,161 |
| Europeans | 94.1 /100 | #121 | Exceptional $108,099 |
| Immigrants | Jordan | 92.9 /100 | #122 | Exceptional $107,715 |