Asian vs Swedish Unemployment Among Ages 16 to 19 years
COMPARE
Asian
Swedish
Unemployment Among Ages 16 to 19 years
Unemployment Among Ages 16 to 19 years Comparison
Asians
Swedes
16.9%
UNEMPLOYMENT AMONG AGES 16 TO 19 YEARS
96.6/ 100
METRIC RATING
90th/ 347
METRIC RANK
15.3%
UNEMPLOYMENT AMONG AGES 16 TO 19 YEARS
100.0/ 100
METRIC RATING
6th/ 347
METRIC RANK
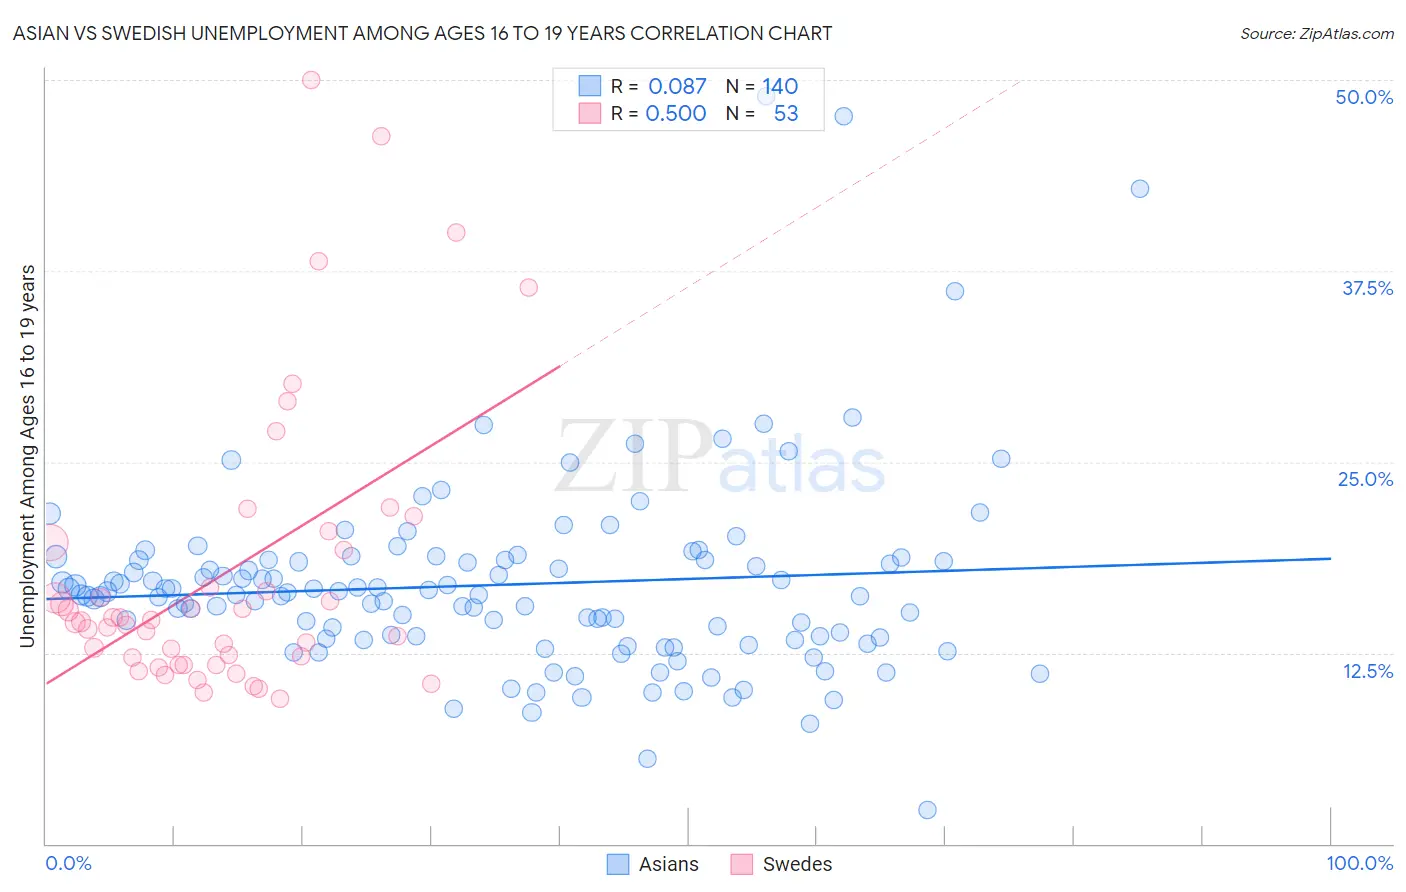
Asian vs Swedish Unemployment Among Ages 16 to 19 years Correlation Chart
The statistical analysis conducted on geographies consisting of 499,790,335 people shows a slight positive correlation between the proportion of Asians and unemployment rate among population between the ages 16 and 19 in the United States with a correlation coefficient (R) of 0.087 and weighted average of 16.9%. Similarly, the statistical analysis conducted on geographies consisting of 486,284,600 people shows a moderate positive correlation between the proportion of Swedes and unemployment rate among population between the ages 16 and 19 in the United States with a correlation coefficient (R) of 0.500 and weighted average of 15.3%, a difference of 10.2%.
Unemployment Among Ages 16 to 19 years Correlation Summary
| Measurement | Asian | Swedish |
| Minimum | 2.2% | 9.5% |
| Maximum | 48.9% | 50.0% |
| Range | 46.7% | 40.5% |
| Mean | 17.0% | 17.7% |
| Median | 16.3% | 14.5% |
| Interquartile 25% (IQ1) | 13.5% | 12.0% |
| Interquartile 75% (IQ3) | 18.6% | 19.5% |
| Interquartile Range (IQR) | 5.1% | 7.5% |
| Standard Deviation (Sample) | 6.4% | 9.3% |
| Standard Deviation (Population) | 6.4% | 9.2% |
Similar Demographics by Unemployment Among Ages 16 to 19 years
Demographics Similar to Asians by Unemployment Among Ages 16 to 19 years
In terms of unemployment among ages 16 to 19 years, the demographic groups most similar to Asians are Canadian (16.9%, a difference of 0.040%), Cambodian (16.9%, a difference of 0.080%), Immigrants from South Africa (16.9%, a difference of 0.13%), Greek (16.9%, a difference of 0.19%), and South African (16.9%, a difference of 0.21%).
| Demographics | Rating | Rank | Unemployment Among Ages 16 to 19 years |
| Ugandans | 97.4 /100 | #83 | Exceptional 16.8% |
| French | 97.4 /100 | #84 | Exceptional 16.8% |
| Immigrants | Kuwait | 97.2 /100 | #85 | Exceptional 16.8% |
| Immigrants | Scotland | 97.2 /100 | #86 | Exceptional 16.8% |
| Greeks | 97.0 /100 | #87 | Exceptional 16.9% |
| Immigrants | South Africa | 96.9 /100 | #88 | Exceptional 16.9% |
| Canadians | 96.7 /100 | #89 | Exceptional 16.9% |
| Asians | 96.6 /100 | #90 | Exceptional 16.9% |
| Cambodians | 96.3 /100 | #91 | Exceptional 16.9% |
| South Africans | 95.9 /100 | #92 | Exceptional 16.9% |
| Cubans | 95.8 /100 | #93 | Exceptional 16.9% |
| Bangladeshis | 95.8 /100 | #94 | Exceptional 16.9% |
| Mongolians | 95.6 /100 | #95 | Exceptional 16.9% |
| Ottawa | 95.4 /100 | #96 | Exceptional 16.9% |
| Immigrants | Venezuela | 95.3 /100 | #97 | Exceptional 16.9% |
Demographics Similar to Swedes by Unemployment Among Ages 16 to 19 years
In terms of unemployment among ages 16 to 19 years, the demographic groups most similar to Swedes are Immigrants from Bosnia and Herzegovina (15.3%, a difference of 0.17%), Immigrants from Somalia (15.3%, a difference of 0.27%), Czech (15.4%, a difference of 0.41%), Scandinavian (15.4%, a difference of 0.74%), and Zimbabwean (15.4%, a difference of 0.86%).
| Demographics | Rating | Rank | Unemployment Among Ages 16 to 19 years |
| Norwegians | 100.0 /100 | #1 | Exceptional 14.5% |
| Immigrants | India | 100.0 /100 | #2 | Exceptional 15.0% |
| Luxembourgers | 100.0 /100 | #3 | Exceptional 15.1% |
| Danes | 100.0 /100 | #4 | Exceptional 15.2% |
| Immigrants | Somalia | 100.0 /100 | #5 | Exceptional 15.3% |
| Swedes | 100.0 /100 | #6 | Exceptional 15.3% |
| Immigrants | Bosnia and Herzegovina | 100.0 /100 | #7 | Exceptional 15.3% |
| Czechs | 100.0 /100 | #8 | Exceptional 15.4% |
| Scandinavians | 100.0 /100 | #9 | Exceptional 15.4% |
| Zimbabweans | 100.0 /100 | #10 | Exceptional 15.4% |
| Indonesians | 100.0 /100 | #11 | Exceptional 15.5% |
| Taiwanese | 100.0 /100 | #12 | Exceptional 15.5% |
| Immigrants | Burma/Myanmar | 100.0 /100 | #13 | Exceptional 15.6% |
| Immigrants | Zaire | 100.0 /100 | #14 | Exceptional 15.6% |
| Yugoslavians | 100.0 /100 | #15 | Exceptional 15.6% |