Zip Codes with the Highest Percentage of Population Employed in Arts, Entertainment & Recreation in Belleville, IL
RELATED REPORTS & OPTIONS
Arts, Entertainment & Recreation
Belleville
Compare Zip Codes
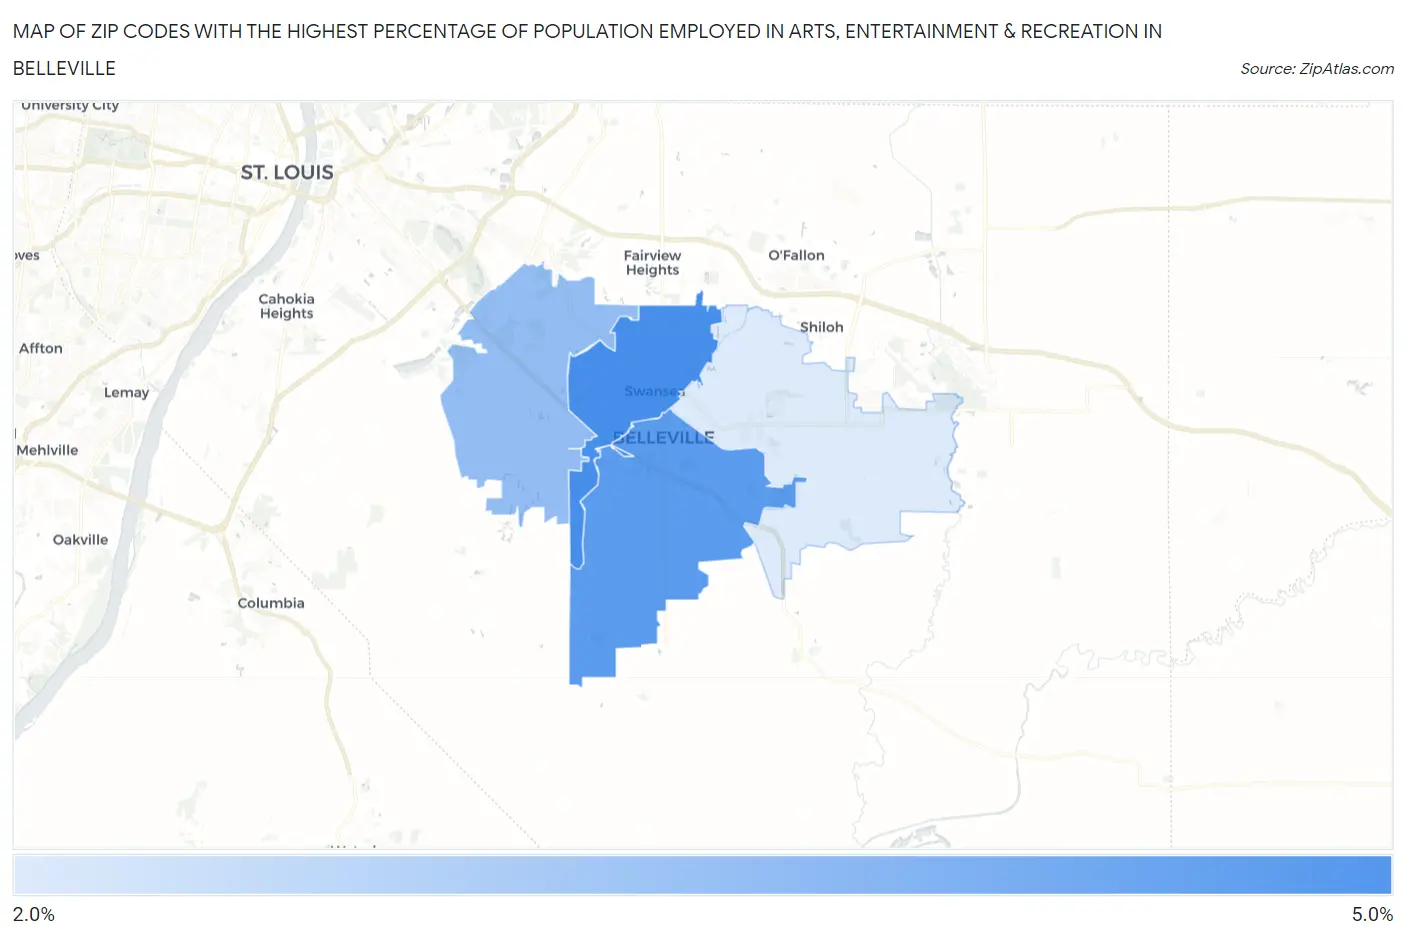
Map of Zip Codes with the Highest Percentage of Population Employed in Arts, Entertainment & Recreation in Belleville
0.0%
5.0%
Zip Codes with the Highest Percentage of Population Employed in Arts, Entertainment & Recreation in Belleville, IL
| Zip Code | % Employed | vs State | vs National | |
| 1. | 62226 | 4.2% | 1.9%(+2.31)#60 | 2.1%(+2.16)#3,030 |
| 2. | 62220 | 4.0% | 1.9%(+2.06)#68 | 2.1%(+1.91)#3,351 |
| 3. | 62223 | 3.2% | 1.9%(+1.24)#117 | 2.1%(+1.09)#4,881 |
| 4. | 62221 | 2.2% | 1.9%(+0.218)#293 | 2.1%(+0.070)#8,908 |
1
Common Questions
What are the Top 3 Zip Codes with the Highest Percentage of Population Employed in Arts, Entertainment & Recreation in Belleville, IL?
Top 3 Zip Codes with the Highest Percentage of Population Employed in Arts, Entertainment & Recreation in Belleville, IL are:
What zip code has the Highest Percentage of Population Employed in Arts, Entertainment & Recreation in Belleville, IL?
62226 has the Highest Percentage of Population Employed in Arts, Entertainment & Recreation in Belleville, IL with 4.2%.
What is the Percentage of Population Employed in Arts, Entertainment & Recreation in Belleville, IL?
Percentage of Population Employed in Arts, Entertainment & Recreation in Belleville is 4.3%.
What is the Percentage of Population Employed in Arts, Entertainment & Recreation in Illinois?
Percentage of Population Employed in Arts, Entertainment & Recreation in Illinois is 1.9%.
What is the Percentage of Population Employed in Arts, Entertainment & Recreation in the United States?
Percentage of Population Employed in Arts, Entertainment & Recreation in the United States is 2.1%.