Zip Codes with the Highest Percentage of Self-Employed / Incorporated in Iowa
RELATED REPORTS & OPTIONS
Self-Employed / Incorporated
Iowa
Compare Zip Codes
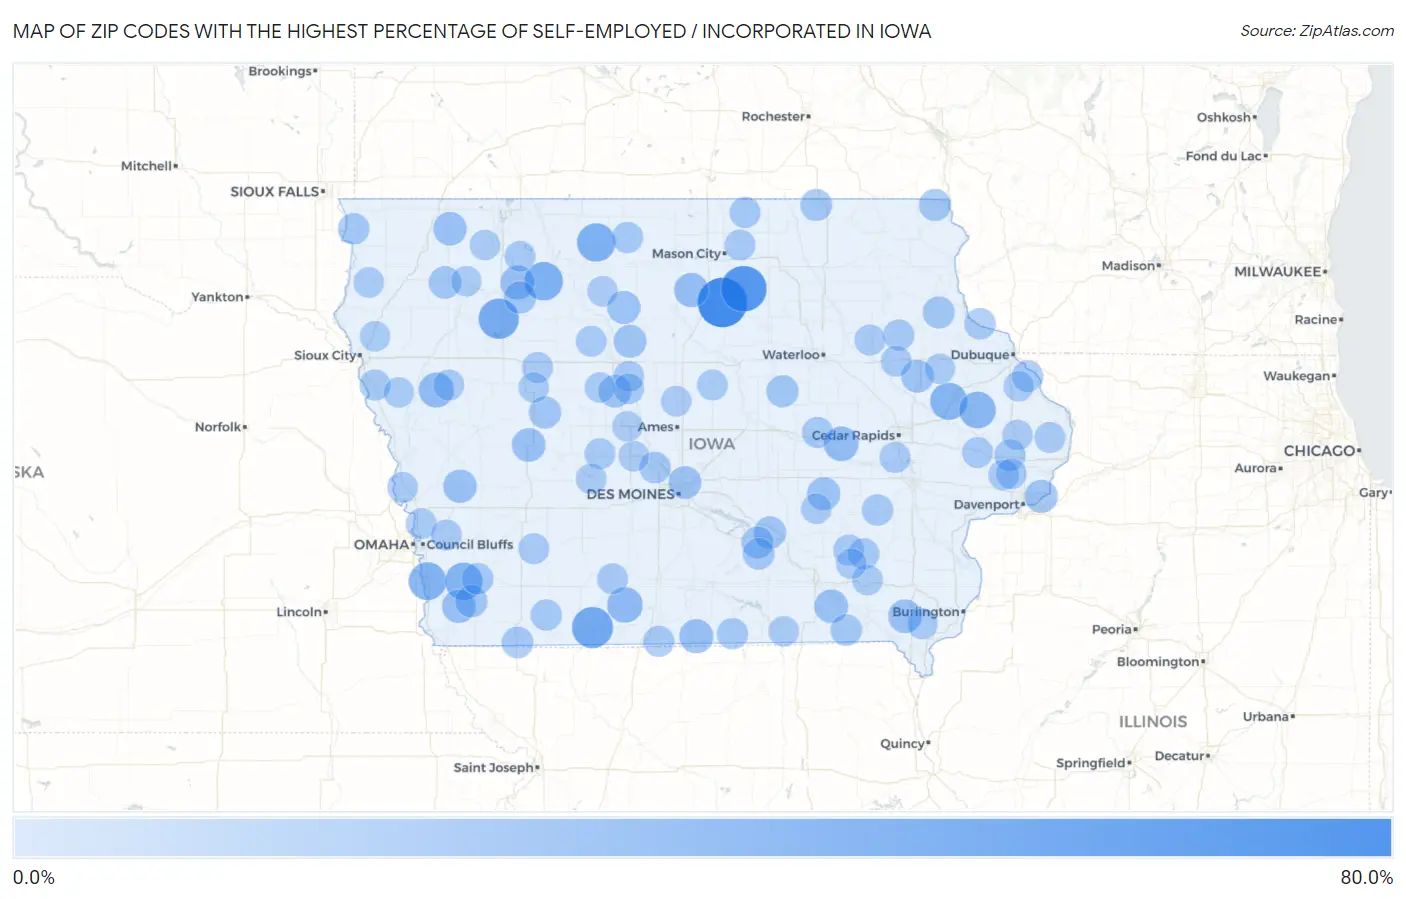
Map of Zip Codes with the Highest Percentage of Self-Employed / Incorporated in Iowa
0.0%
80.0%
Zip Codes with the Highest Percentage of Self-Employed / Incorporated in Iowa
| Zip Code | % Self-Employed / Incorporated | vs State | vs National | |
| 1. | 50427 | 69.1% | 3.7%(+65.4)#1 | 3.8%(+65.3)#40 |
| 2. | 50433 | 57.1% | 3.7%(+53.4)#2 | 3.8%(+53.3)#61 |
| 3. | 50835 | 42.1% | 3.7%(+38.4)#3 | 3.8%(+38.3)#118 |
| 4. | 50592 | 39.7% | 3.7%(+35.9)#4 | 3.8%(+35.8)#134 |
| 5. | 50527 | 34.0% | 3.7%(+30.3)#5 | 3.8%(+30.2)#171 |
| 6. | 50559 | 33.9% | 3.7%(+30.2)#6 | 3.8%(+30.1)#173 |
| 7. | 51561 | 31.6% | 3.7%(+27.9)#7 | 3.8%(+27.8)#196 |
| 8. | 51540 | 31.0% | 3.7%(+27.3)#8 | 3.8%(+27.2)#205 |
| 9. | 52252 | 29.9% | 3.7%(+26.1)#9 | 3.8%(+26.0)#219 |
| 10. | 52321 | 28.4% | 3.7%(+24.6)#10 | 3.8%(+24.6)#244 |
| 11. | 50074 | 24.7% | 3.7%(+21.0)#11 | 3.8%(+20.9)#320 |
| 12. | 51019 | 23.6% | 3.7%(+19.9)#12 | 3.8%(+19.8)#352 |
| 13. | 52257 | 22.3% | 3.7%(+18.6)#13 | 3.8%(+18.5)#400 |
| 14. | 50457 | 20.7% | 3.7%(+17.0)#14 | 3.8%(+16.9)#469 |
| 15. | 50052 | 20.5% | 3.7%(+16.8)#15 | 3.8%(+16.7)#482 |
| 16. | 51366 | 20.3% | 3.7%(+16.6)#16 | 3.8%(+16.5)#491 |
| 17. | 52560 | 19.4% | 3.7%(+15.7)#17 | 3.8%(+15.6)#535 |
| 18. | 51463 | 19.3% | 3.7%(+15.5)#18 | 3.8%(+15.4)#543 |
| 19. | 52631 | 19.2% | 3.7%(+15.5)#19 | 3.8%(+15.4)#550 |
| 20. | 51350 | 18.8% | 3.7%(+15.0)#20 | 3.8%(+15.0)#569 |
| 21. | 51565 | 18.7% | 3.7%(+14.9)#21 | 3.8%(+14.8)#575 |
| 22. | 51649 | 18.3% | 3.7%(+14.5)#22 | 3.8%(+14.5)#606 |
| 23. | 52222 | 17.8% | 3.7%(+14.1)#23 | 3.8%(+14.0)#640 |
| 24. | 50545 | 17.5% | 3.7%(+13.7)#24 | 3.8%(+13.6)#664 |
| 25. | 52767 | 17.2% | 3.7%(+13.5)#25 | 3.8%(+13.4)#688 |
| 26. | 50594 | 16.9% | 3.7%(+13.2)#26 | 3.8%(+13.1)#713 |
| 27. | 50032 | 16.8% | 3.7%(+13.0)#27 | 3.8%(+12.9)#729 |
| 28. | 50544 | 16.3% | 3.7%(+12.6)#28 | 3.8%(+12.5)#780 |
| 29. | 52330 | 16.1% | 3.7%(+12.3)#29 | 3.8%(+12.3)#806 |
| 30. | 51046 | 15.5% | 3.7%(+11.7)#30 | 3.8%(+11.7)#885 |
| 31. | 51452 | 15.0% | 3.7%(+11.3)#31 | 3.8%(+11.2)#952 |
| 32. | 50565 | 14.9% | 3.7%(+11.2)#32 | 3.8%(+11.1)#960 |
| 33. | 50143 | 14.9% | 3.7%(+11.2)#33 | 3.8%(+11.1)#973 |
| 34. | 51645 | 14.9% | 3.7%(+11.1)#34 | 3.8%(+11.0)#982 |
| 35. | 50652 | 14.5% | 3.7%(+10.8)#35 | 3.8%(+10.7)#1,037 |
| 36. | 50256 | 14.3% | 3.7%(+10.5)#36 | 3.8%(+10.5)#1,071 |
| 37. | 52044 | 14.0% | 3.7%(+10.2)#37 | 3.8%(+10.2)#1,134 |
| 38. | 52160 | 13.9% | 3.7%(+10.2)#38 | 3.8%(+10.1)#1,148 |
| 39. | 52134 | 13.8% | 3.7%(+10.1)#39 | 3.8%(+10.0)#1,168 |
| 40. | 50044 | 13.4% | 3.7%(+9.65)#40 | 3.8%(+9.58)#1,250 |
| 41. | 51631 | 13.1% | 3.7%(+9.38)#41 | 3.8%(+9.31)#1,293 |
| 42. | 50109 | 13.1% | 3.7%(+9.31)#42 | 3.8%(+9.24)#1,310 |
| 43. | 52570 | 12.6% | 3.7%(+8.82)#43 | 3.8%(+8.75)#1,425 |
| 44. | 51533 | 12.4% | 3.7%(+8.63)#44 | 3.8%(+8.56)#1,480 |
| 45. | 52071 | 12.3% | 3.7%(+8.58)#45 | 3.8%(+8.51)#1,489 |
| 46. | 51240 | 12.3% | 3.7%(+8.52)#46 | 3.8%(+8.45)#1,501 |
| 47. | 52356 | 12.2% | 3.7%(+8.50)#47 | 3.8%(+8.43)#1,506 |
| 48. | 52066 | 12.1% | 3.7%(+8.37)#48 | 3.8%(+8.30)#1,540 |
| 49. | 50848 | 11.8% | 3.7%(+8.02)#49 | 3.8%(+7.95)#1,627 |
| 50. | 52590 | 11.7% | 3.7%(+7.95)#50 | 3.8%(+7.88)#1,657 |
| 51. | 50480 | 11.6% | 3.7%(+7.82)#51 | 3.8%(+7.75)#1,700 |
| 52. | 50650 | 11.6% | 3.7%(+7.82)#52 | 3.8%(+7.75)#1,702 |
| 53. | 51052 | 11.3% | 3.7%(+7.52)#53 | 3.8%(+7.45)#1,782 |
| 54. | 52585 | 11.3% | 3.7%(+7.51)#54 | 3.8%(+7.44)#1,786 |
| 55. | 50065 | 11.2% | 3.7%(+7.50)#55 | 3.8%(+7.43)#1,789 |
| 56. | 52348 | 11.1% | 3.7%(+7.36)#56 | 3.8%(+7.29)#1,849 |
| 57. | 50426 | 11.1% | 3.7%(+7.36)#57 | 3.8%(+7.29)#1,850 |
| 58. | 52751 | 11.1% | 3.7%(+7.32)#58 | 3.8%(+7.25)#1,863 |
| 59. | 52576 | 10.9% | 3.7%(+7.19)#59 | 3.8%(+7.12)#1,920 |
| 60. | 50561 | 10.9% | 3.7%(+7.18)#60 | 3.8%(+7.11)#1,923 |
| 61. | 50467 | 10.9% | 3.7%(+7.16)#61 | 3.8%(+7.09)#1,933 |
| 62. | 50843 | 10.9% | 3.7%(+7.15)#62 | 3.8%(+7.08)#1,936 |
| 63. | 52727 | 10.9% | 3.7%(+7.14)#63 | 3.8%(+7.07)#1,940 |
| 64. | 50830 | 10.9% | 3.7%(+7.13)#64 | 3.8%(+7.06)#1,944 |
| 65. | 50641 | 10.9% | 3.7%(+7.11)#65 | 3.8%(+7.04)#1,952 |
| 66. | 52338 | 10.8% | 3.7%(+7.08)#66 | 3.8%(+7.01)#1,963 |
| 67. | 50682 | 10.8% | 3.7%(+7.04)#67 | 3.8%(+6.97)#1,986 |
| 68. | 51006 | 10.6% | 3.7%(+6.88)#68 | 3.8%(+6.81)#2,057 |
| 69. | 51526 | 10.6% | 3.7%(+6.87)#69 | 3.8%(+6.80)#2,059 |
| 70. | 50128 | 10.6% | 3.7%(+6.84)#70 | 3.8%(+6.77)#2,071 |
| 71. | 50122 | 10.5% | 3.7%(+6.76)#71 | 3.8%(+6.69)#2,098 |
| 72. | 52255 | 10.4% | 3.7%(+6.64)#72 | 3.8%(+6.57)#2,139 |
| 73. | 52656 | 10.4% | 3.7%(+6.62)#73 | 3.8%(+6.55)#2,149 |
| 74. | 52745 | 10.3% | 3.7%(+6.60)#74 | 3.8%(+6.53)#2,156 |
| 75. | 51556 | 10.3% | 3.7%(+6.58)#75 | 3.8%(+6.51)#2,159 |
| 76. | 50524 | 10.3% | 3.7%(+6.56)#76 | 3.8%(+6.49)#2,168 |
| 77. | 51548 | 10.3% | 3.7%(+6.51)#77 | 3.8%(+6.44)#2,196 |
| 78. | 50557 | 10.1% | 3.7%(+6.37)#78 | 3.8%(+6.30)#2,259 |
| 79. | 52746 | 10.1% | 3.7%(+6.34)#79 | 3.8%(+6.27)#2,272 |
| 80. | 51333 | 10.0% | 3.7%(+6.30)#80 | 3.8%(+6.23)#2,292 |
| 81. | 52556 | 10.0% | 3.7%(+6.25)#81 | 3.8%(+6.18)#2,324 |
| 82. | 50530 | 10.0% | 3.7%(+6.22)#82 | 3.8%(+6.15)#2,337 |
| 83. | 50039 | 9.7% | 3.7%(+6.00)#83 | 3.8%(+5.93)#2,439 |
| 84. | 50519 | 9.7% | 3.7%(+5.99)#84 | 3.8%(+5.92)#2,443 |
| 85. | 51027 | 9.7% | 3.7%(+5.98)#85 | 3.8%(+5.91)#2,449 |
| 86. | 50248 | 9.7% | 3.7%(+5.94)#86 | 3.8%(+5.87)#2,472 |
| 87. | 50104 | 9.7% | 3.7%(+5.93)#87 | 3.8%(+5.86)#2,480 |
| 88. | 50212 | 9.7% | 3.7%(+5.91)#88 | 3.8%(+5.84)#2,488 |
| 89. | 52037 | 9.6% | 3.7%(+5.89)#89 | 3.8%(+5.82)#2,504 |
| 90. | 52580 | 9.6% | 3.7%(+5.89)#90 | 3.8%(+5.82)#2,505 |
| 91. | 50216 | 9.6% | 3.7%(+5.86)#91 | 3.8%(+5.79)#2,528 |
| 92. | 50543 | 9.5% | 3.7%(+5.77)#92 | 3.8%(+5.70)#2,580 |
| 93. | 52572 | 9.5% | 3.7%(+5.75)#93 | 3.8%(+5.68)#2,592 |
| 94. | 51433 | 9.5% | 3.7%(+5.74)#94 | 3.8%(+5.67)#2,599 |
| 95. | 52223 | 9.4% | 3.7%(+5.67)#95 | 3.8%(+5.60)#2,630 |
| 96. | 51024 | 9.3% | 3.7%(+5.59)#96 | 3.8%(+5.52)#2,675 |
| 97. | 51338 | 9.3% | 3.7%(+5.52)#97 | 3.8%(+5.45)#2,711 |
| 98. | 51058 | 9.3% | 3.7%(+5.52)#98 | 3.8%(+5.45)#2,719 |
| 99. | 51026 | 9.3% | 3.7%(+5.51)#99 | 3.8%(+5.44)#2,726 |
| 100. | 52054 | 9.2% | 3.7%(+5.50)#100 | 3.8%(+5.43)#2,727 |
Common Questions
What are the Top 10 Zip Codes with the Highest Percentage of Self-Employed / Incorporated in Iowa?
Top 10 Zip Codes with the Highest Percentage of Self-Employed / Incorporated in Iowa are:
What zip code has the Highest Percentage of Self-Employed / Incorporated in Iowa?
50427 has the Highest Percentage of Self-Employed / Incorporated in Iowa with 69.1%.
What is the Percentage of Self-Employed / Incorporated in the State of Iowa?
Percentage of Self-Employed / Incorporated in Iowa is 3.7%.
What is the Percentage of Self-Employed / Incorporated in the United States?
Percentage of Self-Employed / Incorporated in the United States is 3.8%.