Zip Codes with the Highest Percentage of Population Employed in Arts, Entertainment & Recreation in Iowa
RELATED REPORTS & OPTIONS
Arts, Entertainment & Recreation
Iowa
Compare Zip Codes
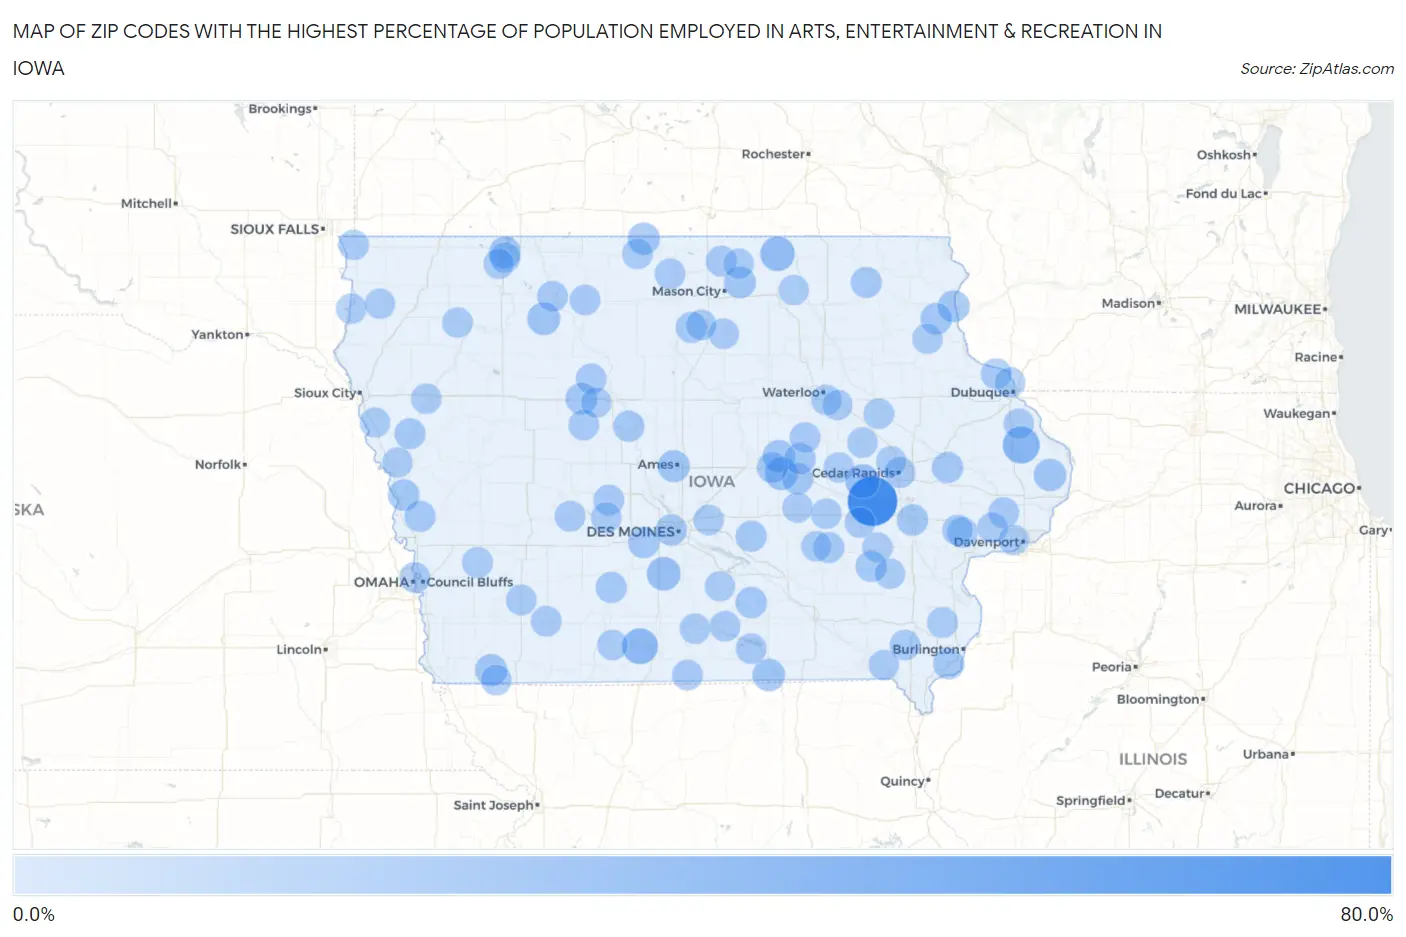
Map of Zip Codes with the Highest Percentage of Population Employed in Arts, Entertainment & Recreation in Iowa
0.0%
80.0%
Zip Codes with the Highest Percentage of Population Employed in Arts, Entertainment & Recreation in Iowa
| Zip Code | % Employed | vs State | vs National | |
| 1. | 52307 | 64.6% | 1.5%(+63.1)#1 | 2.1%(+62.5)#22 |
| 2. | 52030 | 23.5% | 1.5%(+22.0)#2 | 2.1%(+21.4)#129 |
| 3. | 50108 | 20.0% | 1.5%(+18.5)#3 | 2.1%(+17.9)#182 |
| 4. | 50454 | 15.8% | 1.5%(+14.3)#4 | 2.1%(+13.7)#304 |
| 5. | 52354 | 14.5% | 1.5%(+13.0)#5 | 2.1%(+12.4)#363 |
| 6. | 50241 | 13.5% | 1.5%(+12.0)#6 | 2.1%(+11.4)#417 |
| 7. | 50527 | 10.6% | 1.5%(+9.12)#7 | 2.1%(+8.56)#632 |
| 8. | 50173 | 10.4% | 1.5%(+8.89)#8 | 2.1%(+8.33)#657 |
| 9. | 52555 | 9.6% | 1.5%(+8.06)#9 | 2.1%(+7.49)#769 |
| 10. | 52727 | 9.4% | 1.5%(+7.89)#10 | 2.1%(+7.32)#793 |
| 11. | 50632 | 9.1% | 1.5%(+7.54)#11 | 2.1%(+6.97)#849 |
| 12. | 50465 | 8.6% | 1.5%(+7.05)#12 | 2.1%(+6.49)#925 |
| 13. | 50013 | 8.4% | 1.5%(+6.91)#13 | 2.1%(+6.35)#961 |
| 14. | 51636 | 8.0% | 1.5%(+6.46)#14 | 2.1%(+5.90)#1,064 |
| 15. | 52158 | 7.5% | 1.5%(+5.94)#15 | 2.1%(+5.37)#1,188 |
| 16. | 50467 | 7.3% | 1.5%(+5.76)#16 | 2.1%(+5.19)#1,247 |
| 17. | 51355 | 7.2% | 1.5%(+5.66)#17 | 2.1%(+5.09)#1,273 |
| 18. | 52047 | 6.8% | 1.5%(+5.26)#18 | 2.1%(+4.70)#1,397 |
| 19. | 50552 | 6.5% | 1.5%(+5.00)#19 | 2.1%(+4.44)#1,482 |
| 20. | 52339 | 6.4% | 1.5%(+4.87)#20 | 2.1%(+4.31)#1,545 |
| 21. | 51545 | 6.3% | 1.5%(+4.81)#21 | 2.1%(+4.25)#1,569 |
| 22. | 50038 | 6.3% | 1.5%(+4.79)#22 | 2.1%(+4.22)#1,585 |
| 23. | 52242 | 6.2% | 1.5%(+4.70)#23 | 2.1%(+4.13)#1,622 |
| 24. | 52342 | 6.0% | 1.5%(+4.46)#24 | 2.1%(+3.90)#1,712 |
| 25. | 50150 | 5.9% | 1.5%(+4.43)#25 | 2.1%(+3.87)#1,726 |
| 26. | 50311 | 5.8% | 1.5%(+4.26)#26 | 2.1%(+3.70)#1,819 |
| 27. | 52312 | 5.7% | 1.5%(+4.20)#27 | 2.1%(+3.63)#1,848 |
| 28. | 52658 | 5.6% | 1.5%(+4.06)#28 | 2.1%(+3.49)#1,924 |
| 29. | 52248 | 5.5% | 1.5%(+3.98)#29 | 2.1%(+3.42)#1,966 |
| 30. | 50530 | 5.4% | 1.5%(+3.93)#30 | 2.1%(+3.36)#1,996 |
| 31. | 51550 | 5.4% | 1.5%(+3.89)#31 | 2.1%(+3.32)#2,017 |
| 32. | 50155 | 5.3% | 1.5%(+3.82)#32 | 2.1%(+3.25)#2,064 |
| 33. | 50136 | 5.3% | 1.5%(+3.75)#33 | 2.1%(+3.18)#2,105 |
| 34. | 50232 | 5.2% | 1.5%(+3.69)#34 | 2.1%(+3.13)#2,147 |
| 35. | 50142 | 5.2% | 1.5%(+3.68)#35 | 2.1%(+3.12)#2,156 |
| 36. | 50457 | 5.0% | 1.5%(+3.53)#36 | 2.1%(+2.96)#2,254 |
| 37. | 51056 | 4.8% | 1.5%(+3.31)#37 | 2.1%(+2.74)#2,418 |
| 38. | 52168 | 4.8% | 1.5%(+3.24)#38 | 2.1%(+2.68)#2,472 |
| 39. | 52401 | 4.6% | 1.5%(+3.12)#39 | 2.1%(+2.55)#2,598 |
| 40. | 51536 | 4.6% | 1.5%(+3.07)#40 | 2.1%(+2.50)#2,639 |
| 41. | 50448 | 4.6% | 1.5%(+3.04)#41 | 2.1%(+2.48)#2,673 |
| 42. | 52660 | 4.5% | 1.5%(+2.96)#42 | 2.1%(+2.40)#2,774 |
| 43. | 50536 | 4.5% | 1.5%(+2.94)#43 | 2.1%(+2.37)#2,795 |
| 44. | 50847 | 4.3% | 1.5%(+2.83)#44 | 2.1%(+2.27)#2,906 |
| 45. | 50066 | 4.2% | 1.5%(+2.65)#45 | 2.1%(+2.08)#3,126 |
| 46. | 52760 | 4.1% | 1.5%(+2.56)#46 | 2.1%(+1.99)#3,227 |
| 47. | 52073 | 4.1% | 1.5%(+2.54)#47 | 2.1%(+1.98)#3,250 |
| 48. | 50115 | 4.0% | 1.5%(+2.49)#48 | 2.1%(+1.93)#3,324 |
| 49. | 50841 | 4.0% | 1.5%(+2.49)#49 | 2.1%(+1.92)#3,330 |
| 50. | 52745 | 4.0% | 1.5%(+2.48)#50 | 2.1%(+1.92)#3,337 |
| 51. | 52361 | 4.0% | 1.5%(+2.44)#51 | 2.1%(+1.87)#3,394 |
| 52. | 50147 | 3.9% | 1.5%(+2.42)#52 | 2.1%(+1.85)#3,431 |
| 53. | 51630 | 3.9% | 1.5%(+2.40)#53 | 2.1%(+1.84)#3,453 |
| 54. | 50538 | 3.9% | 1.5%(+2.37)#54 | 2.1%(+1.81)#3,498 |
| 55. | 51510 | 3.9% | 1.5%(+2.34)#55 | 2.1%(+1.77)#3,548 |
| 56. | 50238 | 3.8% | 1.5%(+2.32)#56 | 2.1%(+1.76)#3,571 |
| 57. | 50436 | 3.8% | 1.5%(+2.26)#57 | 2.1%(+1.69)#3,670 |
| 58. | 50475 | 3.7% | 1.5%(+2.23)#58 | 2.1%(+1.67)#3,706 |
| 59. | 50675 | 3.7% | 1.5%(+2.23)#59 | 2.1%(+1.66)#3,710 |
| 60. | 50524 | 3.7% | 1.5%(+2.23)#60 | 2.1%(+1.66)#3,711 |
| 61. | 52574 | 3.6% | 1.5%(+2.11)#61 | 2.1%(+1.55)#3,899 |
| 62. | 50424 | 3.6% | 1.5%(+2.08)#62 | 2.1%(+1.51)#3,961 |
| 63. | 50598 | 3.6% | 1.5%(+2.04)#63 | 2.1%(+1.47)#4,024 |
| 64. | 52349 | 3.5% | 1.5%(+2.03)#64 | 2.1%(+1.46)#4,039 |
| 65. | 52347 | 3.5% | 1.5%(+2.00)#65 | 2.1%(+1.44)#4,085 |
| 66. | 50146 | 3.5% | 1.5%(+1.98)#66 | 2.1%(+1.42)#4,139 |
| 67. | 50566 | 3.5% | 1.5%(+1.98)#67 | 2.1%(+1.41)#4,149 |
| 68. | 52329 | 3.5% | 1.5%(+1.95)#68 | 2.1%(+1.39)#4,198 |
| 69. | 51009 | 3.4% | 1.5%(+1.93)#69 | 2.1%(+1.37)#4,246 |
| 70. | 52649 | 3.4% | 1.5%(+1.92)#70 | 2.1%(+1.35)#4,266 |
| 71. | 50169 | 3.4% | 1.5%(+1.91)#71 | 2.1%(+1.34)#4,305 |
| 72. | 51016 | 3.4% | 1.5%(+1.90)#72 | 2.1%(+1.34)#4,316 |
| 73. | 52720 | 3.4% | 1.5%(+1.84)#73 | 2.1%(+1.28)#4,443 |
| 74. | 50068 | 3.4% | 1.5%(+1.84)#74 | 2.1%(+1.27)#4,453 |
| 75. | 50440 | 3.3% | 1.5%(+1.82)#75 | 2.1%(+1.25)#4,501 |
| 76. | 51331 | 3.3% | 1.5%(+1.80)#76 | 2.1%(+1.23)#4,543 |
| 77. | 51023 | 3.3% | 1.5%(+1.75)#77 | 2.1%(+1.19)#4,633 |
| 78. | 50863 | 3.2% | 1.5%(+1.71)#78 | 2.1%(+1.14)#4,737 |
| 79. | 50104 | 3.2% | 1.5%(+1.71)#79 | 2.1%(+1.14)#4,738 |
| 80. | 50479 | 3.2% | 1.5%(+1.68)#80 | 2.1%(+1.12)#4,811 |
| 81. | 51351 | 3.2% | 1.5%(+1.68)#81 | 2.1%(+1.11)#4,817 |
| 82. | 52054 | 3.2% | 1.5%(+1.66)#82 | 2.1%(+1.10)#4,859 |
| 83. | 52043 | 3.1% | 1.5%(+1.62)#83 | 2.1%(+1.06)#4,963 |
| 84. | 52411 | 3.1% | 1.5%(+1.60)#84 | 2.1%(+1.03)#5,017 |
| 85. | 51040 | 3.1% | 1.5%(+1.56)#85 | 2.1%(+0.992)#5,150 |
| 86. | 52001 | 3.0% | 1.5%(+1.52)#86 | 2.1%(+0.952)#5,249 |
| 87. | 50157 | 3.0% | 1.5%(+1.49)#87 | 2.1%(+0.920)#5,348 |
| 88. | 50702 | 3.0% | 1.5%(+1.47)#88 | 2.1%(+0.906)#5,383 |
| 89. | 52769 | 3.0% | 1.5%(+1.46)#89 | 2.1%(+0.896)#5,425 |
| 90. | 52356 | 2.9% | 1.5%(+1.42)#90 | 2.1%(+0.850)#5,560 |
| 91. | 52804 | 2.9% | 1.5%(+1.40)#91 | 2.1%(+0.836)#5,597 |
| 92. | 51241 | 2.9% | 1.5%(+1.38)#92 | 2.1%(+0.812)#5,660 |
| 93. | 51052 | 2.9% | 1.5%(+1.36)#93 | 2.1%(+0.794)#5,724 |
| 94. | 50634 | 2.9% | 1.5%(+1.34)#94 | 2.1%(+0.775)#5,786 |
| 95. | 50620 | 2.9% | 1.5%(+1.34)#95 | 2.1%(+0.775)#5,791 |
| 96. | 51250 | 2.9% | 1.5%(+1.33)#96 | 2.1%(+0.769)#5,813 |
| 97. | 52353 | 2.8% | 1.5%(+1.33)#97 | 2.1%(+0.767)#5,818 |
| 98. | 52620 | 2.8% | 1.5%(+1.30)#98 | 2.1%(+0.731)#5,942 |
| 99. | 52249 | 2.8% | 1.5%(+1.29)#99 | 2.1%(+0.725)#5,963 |
| 100. | 50163 | 2.8% | 1.5%(+1.29)#100 | 2.1%(+0.721)#5,981 |
Common Questions
What are the Top 10 Zip Codes with the Highest Percentage of Population Employed in Arts, Entertainment & Recreation in Iowa?
Top 10 Zip Codes with the Highest Percentage of Population Employed in Arts, Entertainment & Recreation in Iowa are:
What zip code has the Highest Percentage of Population Employed in Arts, Entertainment & Recreation in Iowa?
52307 has the Highest Percentage of Population Employed in Arts, Entertainment & Recreation in Iowa with 64.6%.
What is the Percentage of Population Employed in Arts, Entertainment & Recreation in the State of Iowa?
Percentage of Population Employed in Arts, Entertainment & Recreation in Iowa is 1.5%.
What is the Percentage of Population Employed in Arts, Entertainment & Recreation in the United States?
Percentage of Population Employed in Arts, Entertainment & Recreation in the United States is 2.1%.